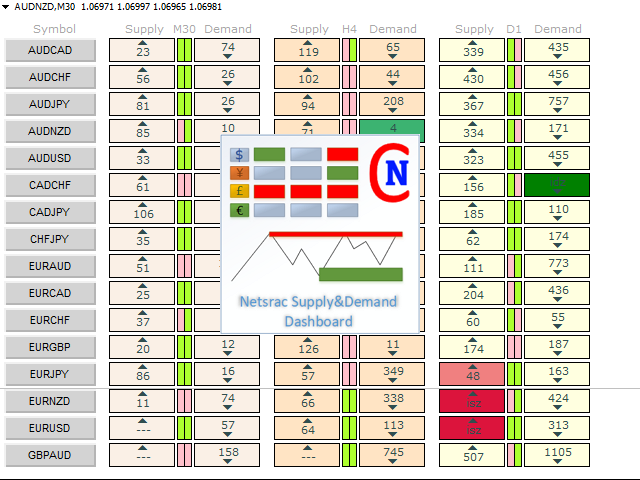
The Netsrac Supply&Demand Dashboard shows you at a glance where relevant zones are located on your favorite assets. Open your chart directly from the dashboard and trade zones that really matter.
Features
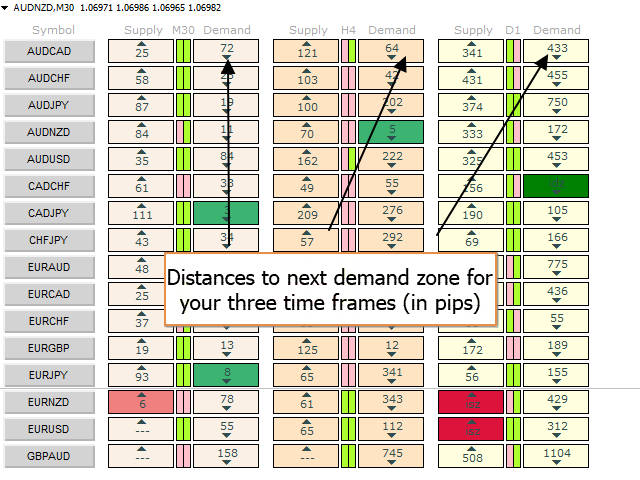
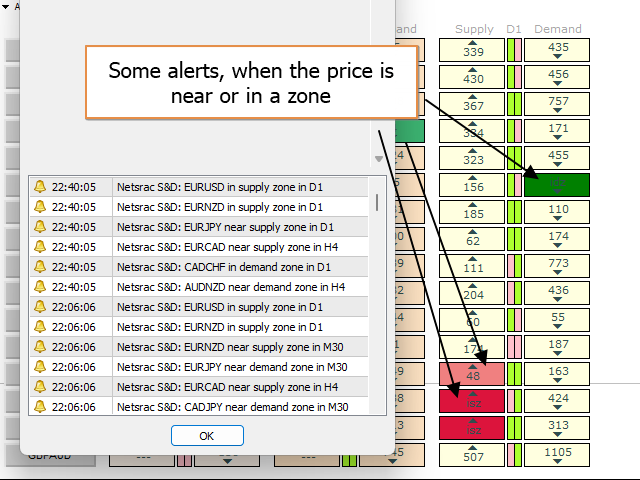
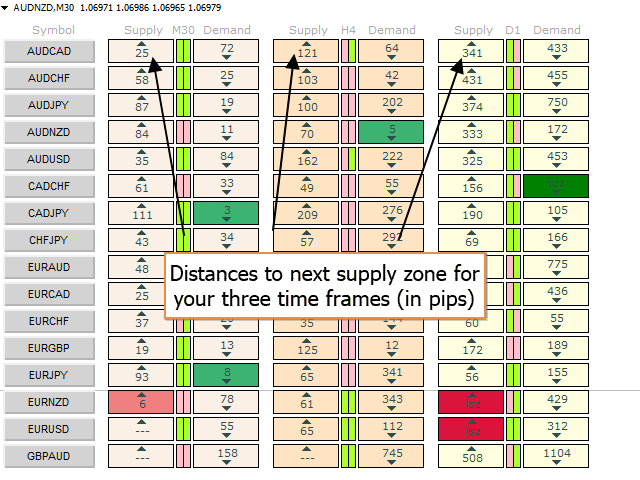
- Finds the next relevant supply and demand zone and displays the distance to this zone (in pips)
- Finds and displays the zones in three different timeframes
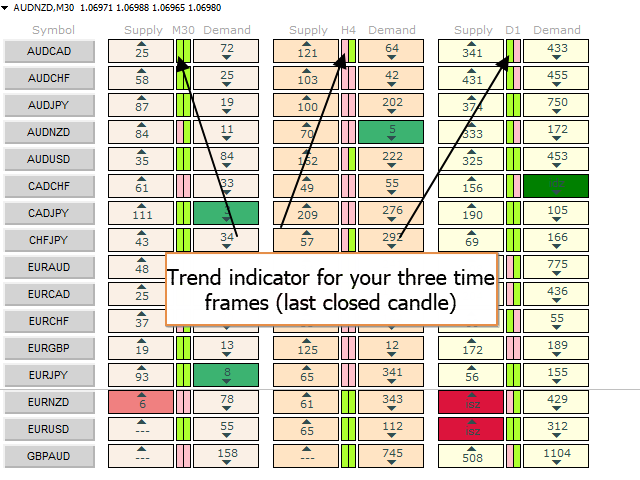
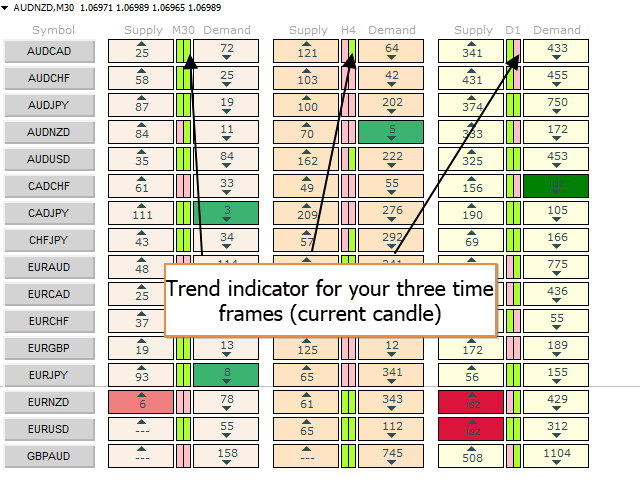
- Calculates a trend indicator for the current and past candle for each configured time frame
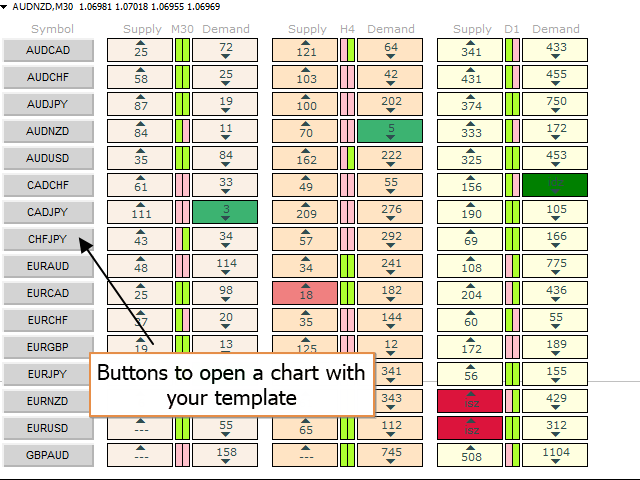
- Opens a chart with your chart template directly with a button for each configured asset
- Works perfectly with Netsrac "Supply and Demand Easy" - Indicator ( https://www.mql5.com/en/market/product/96509 )
Controls
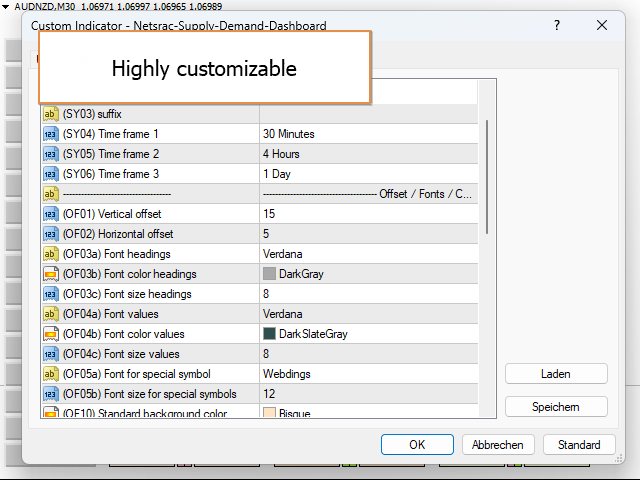
Variable Description (SY01) Symbols/Assets Your list with all symbols you want to watch (SY02) prefix If your broker needs prefixes before the symbol name (SY03) suffix If your broker needs suffixes after the symbol name (SY04) Time frame 1 Your time frame number one (SY05) Time frame 2 Your time frame number two (SY06) Time frame 3 Your time frame number three (OF01) Vertical offset If you want to move the dashboard downwards on the chart (OF02) Horizontal offset If you want to move the dashboard to the right on the chart (OF03a) - (OF20) ... Configure the dashboard color and fonts as you want (AL01) - (AL03) Alerting TF1 - TF3 Configure for which time frame you want to have alerts (AL04) - (AL06) ... Configure the type of alerts (CH01) Chart template Use your favorite chart template, when you open a chart from the dashboard (CH02) Chart time frame Choose the time frame to use (CH03) Open each chart in new window True - if you want a new chart with every click; false - if you want to open each chart in the same window (default) (SD06) Depth Set the depth of the swing calculation algo (lower values produces more swings) I wish you much success with this dashboard!
Netsrac