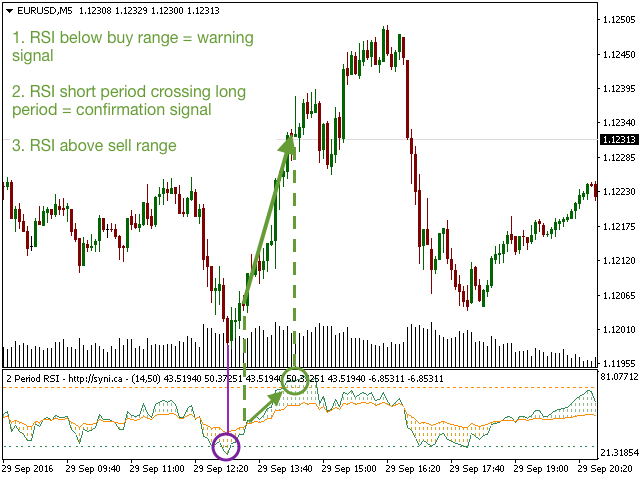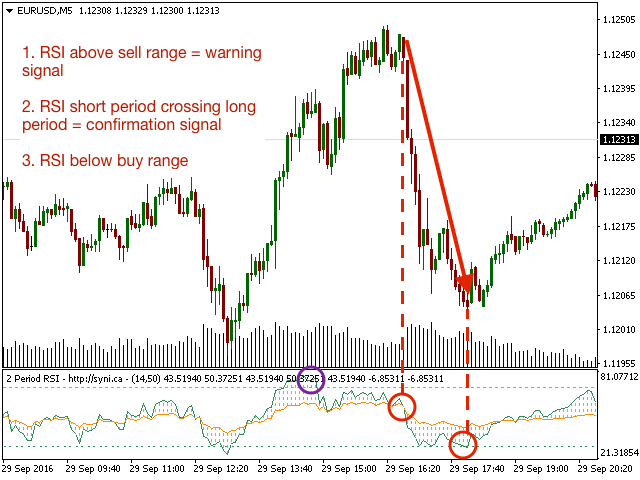
Two Period RSI compares long-term and short-term RSI lines, and plots a fill between them for improved visualization. Fill is colored differently according to an uptrend (short period RSI above long period RSI) or a downtrend (short period RSI below long period RSI). Short-term RSI crossing long-term RSI adds a more robust trend confirmation signal than using single period RSI alone.
This is a small tool to help visualize and confirm RSI trends. We hope you enjoy!
Looking for RSI alerts? You can download our Two Period RSI + Alerts indicator here, which includes user selectable email/message/sound alerts.
Parameters
- Short period (Default=14): number of bars used to calculate short period RSI
- Long period (Default=50): number of bars used to calculate long period RSI