Pivot Classic, Woodie, Camarilla, Fibonacci and Demark
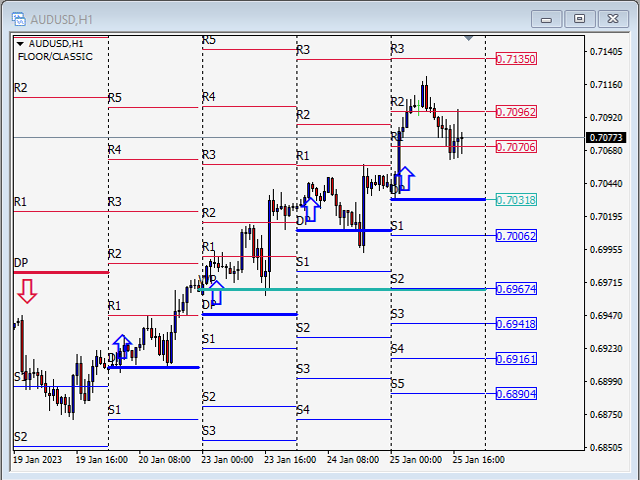
Floor/Classic
Pivot points, or simply pivots, are useful for identifying potential support/resistance levels, trading ranges, trend reversals, and market sentiment by examining an asset's high, low, and closing values. The Floor/Classic Pivot Points can be calculated as follows.
Pivot Point (P) = (High + Low + Close)/3
S1 = P * 2 - High
S2 = P - (High - Low)
S3 = Low – 2*(High - P)
R1 = P * 2 - Low
R2 = P + (High - Low)
R3 = High + 2*(P - Low)
Woodie
It differs from the standard method of calculating the pivot point. It uses the difference between the previous day's high and low, also known as range, to calculate support and resistance levels. Some traders prefer to use the Woodie formulas as they give more weight to the closing price of the previous period. The Woodie Pivot Points can be calculated as follows.
R2 = P + (H - L)
R1 = (2 * P) - LOW
P = (HIGH + LOW + (CLOSE * 2)) / 4
S1 = (2 * P) - HIGH
S2 = P - (H - L)
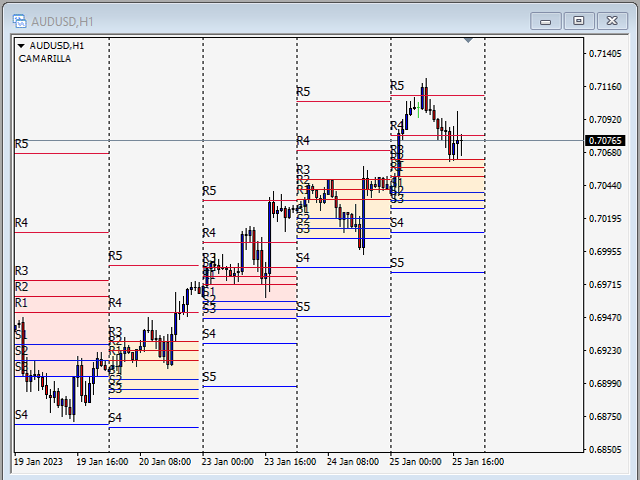
Camarilla
The Camarilla formulas are similar to the Woodie formula. Its basic idea is that price tends to revert to its average. The Camarilla levels help to target accurate stop loss and target profit orders. The most important levels are S3, S4 and R3, R4. The Camarilla Pivot Points can be calculated as follows.
R4 = ((High - Low) * 1.1) / 2 + Close
R3 = ((High - Low) * 1.1) / 4 + Close
R2 = ((High - Low) * 1.1) / 6 + Close
R1 = ((High - Low) * 1.1) / 12 + Close
S1 = Close - ((High - Low) * 1.1) / 12
S2 = Close - ((High - Low) * 1.1) / 6
S3 = Close - ((High - Low) * 1.1) / 4
S4 = Close - ((High - Low) * 1.1) / 2
Fibonacci
Fibonacci pivot point levels are determined by calculating the pivot point first, as in the standard method. Then multiply the previous day's range by the corresponding Fibonacci level. Most traders use 38.2%, 61.8% and 100% corrections in their calculations. The rationale behind this is that many traders use Fibonacci odds. The Fibonacci Pivot Points can be calculated as follows.
Pivot Point (P) = (High + Low + Close)/3
Support 1 (S1) = P - (0.382 * (High - Low))
Support 2 (S2) = P - (0.6182 * (High - Low))
Support 3 (S3) = P - (1 * (High - Low))
Resistance 1 (R1) = P + (0.382 * (High - Low))
Resistance 2 (R2) = P + (0.6182 * (High - Low))
Resistance 3 (R3) = P + (1 * (High - Low))
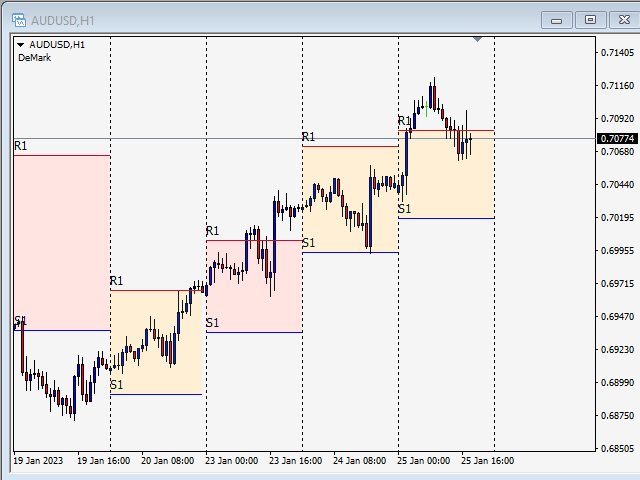
Demark
These pivot points have a conditional nature that places more emphasis on recent price movements based on the relationship between the opening price and the closing price. The Demark Pivot Points can be calculated as follows.
If Close < Open, then X = High + (2 * Low) + Close
If Close > Open, then X = (2 * High) + Low + Close
If Close = Open, then X = High + Low + (2 * Close)
Support 1 (S1) = X/2 - High
Resistance 1 (R1) = X/2 - Low