Automatic Fibonacci Tool
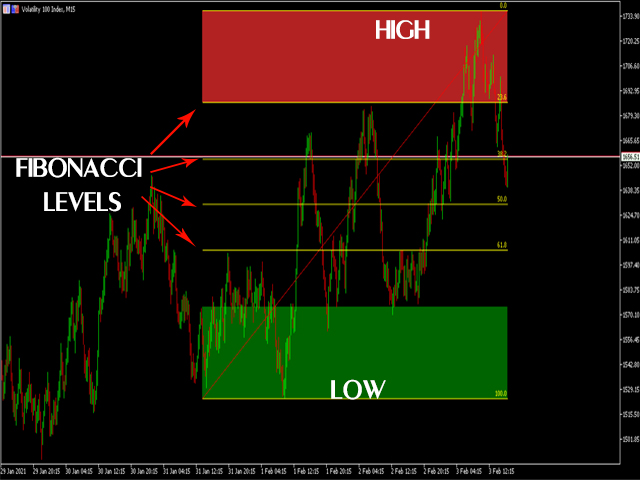
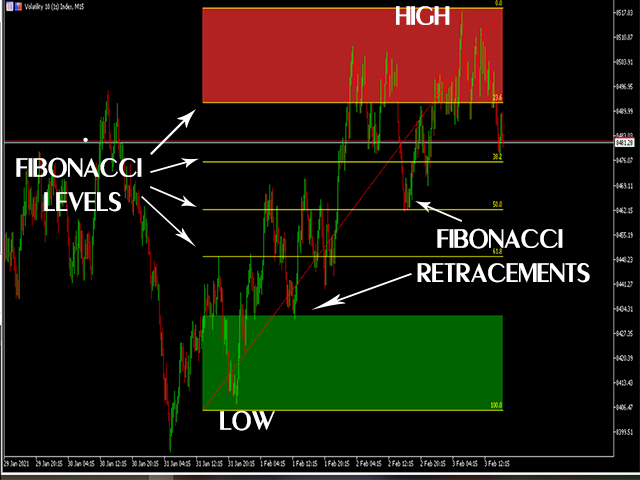
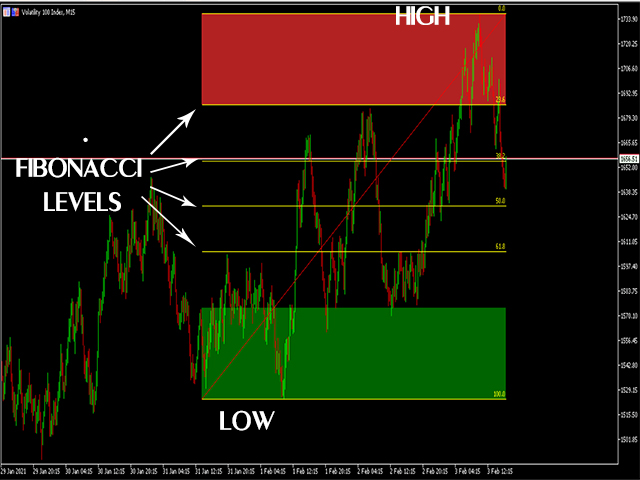
Fibonacci retracements is a popular instrument used by technical analysts to determine potential Support and Resistance areas. In technical analysis, this tool is created by taking two extreme points (usually a peak and a minimum) on the chart and dividing the vertical distance by the key Fibonacci coefficients equal to 23.6%, 38.2%, 50%, 61.8%, and 100%.
Our Automatic Fibonacci Tool is programmed to make thigs easier. Using this tool, there is no need to explicitly set two points, as is done automatically. The indicator will do everything for you. One can customise the general number of bars to be used for drawing the Fibonacci retracement, depending on how they often do their analysis. The indicator will peak the highest ad the lowest points the draw the Fibonacci retracement.
As the rule applies, in an uptrend the tool will draw the retracement from Low to high. In a dowered, the tool will draw the Fibonacci from high to low. This trend is determined automatically and when it changes significantly the tool also changes the method of drawing the Fibonacci.
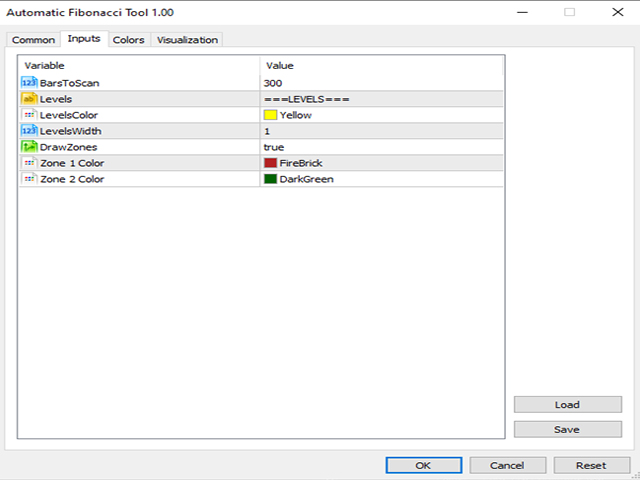
Input Settings
BarstoScan – number of candles to look ack ad draw the Fibonacci tool
LevelsColour – colour of the Fibonacci
LevelsWidth – with of the Fibonacci lines
Zone 1 Colour – colour from the 0% to 23.6%
Zone 2 Colour – colour from the 100% to 76.4%