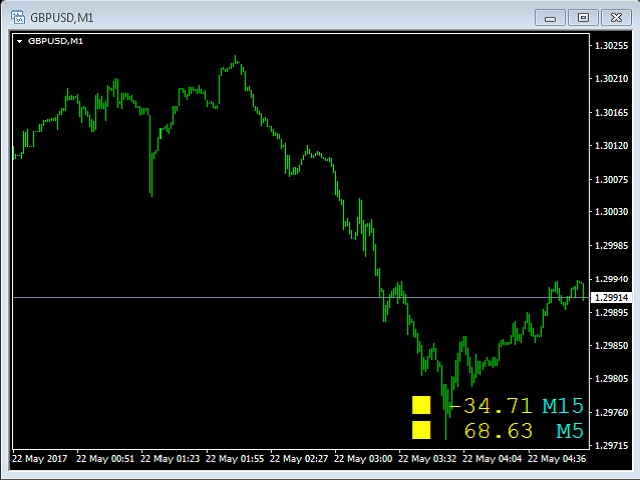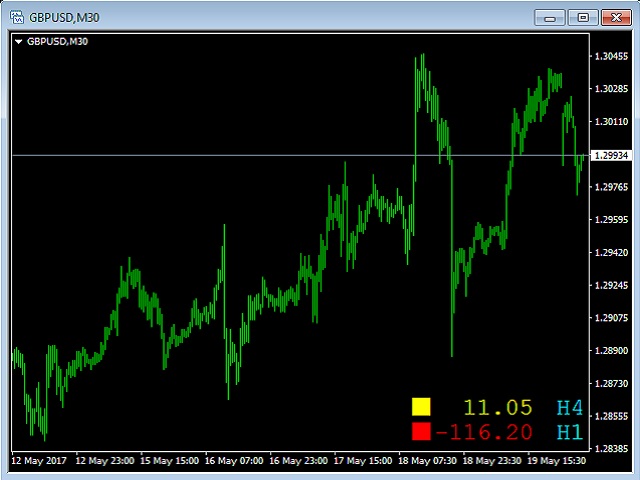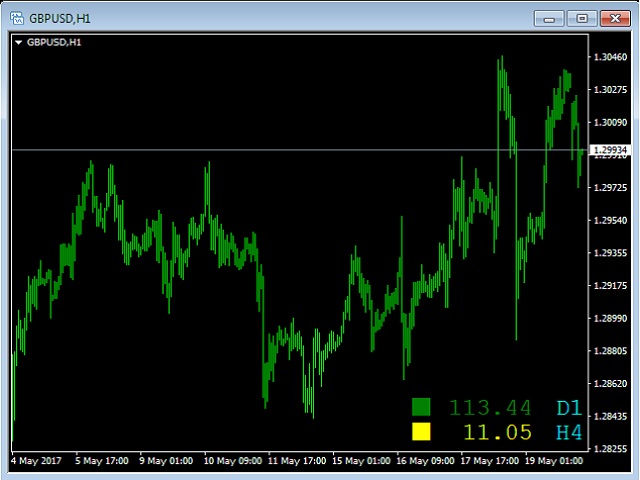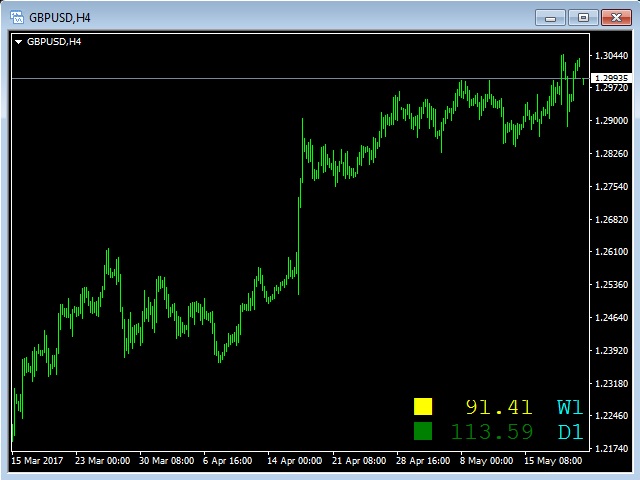
This indicator is based on a classical Commodity Channel Index (CCI) indicator and shows a digital values of CCI from two higher (than current) Time Frames. If, for example, you will put it on the M1 TF it will show a digital values of the CCI from M5 (TF1) and M15 (TF2).
As everybody knows, the CCI is using +100 (LevelUp) and -100 (LevelDn) boundaries. You have the possibility to change those numbers according to your strategy.
When a line graph of the CCI will go higher than LevelUp then a green square will appear near a digital number that represents the CCI indicator.
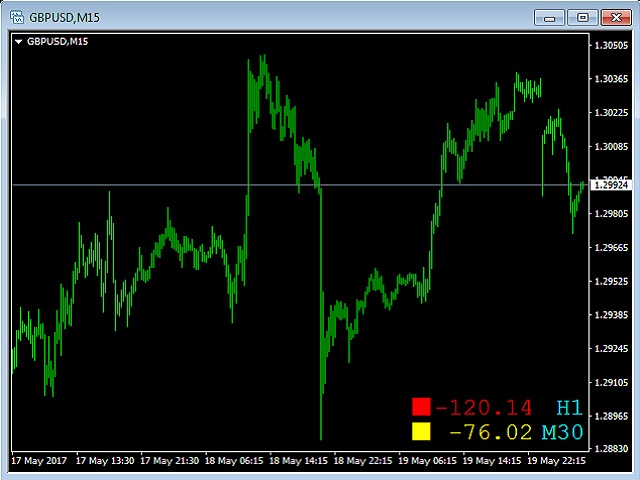
When a line graph of the CCI will go lower than LevelDn then a red square will appear near a digital number that represents the CCI indicator.
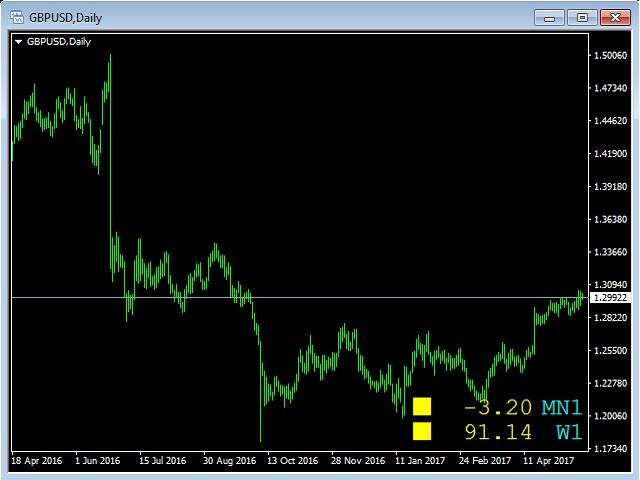
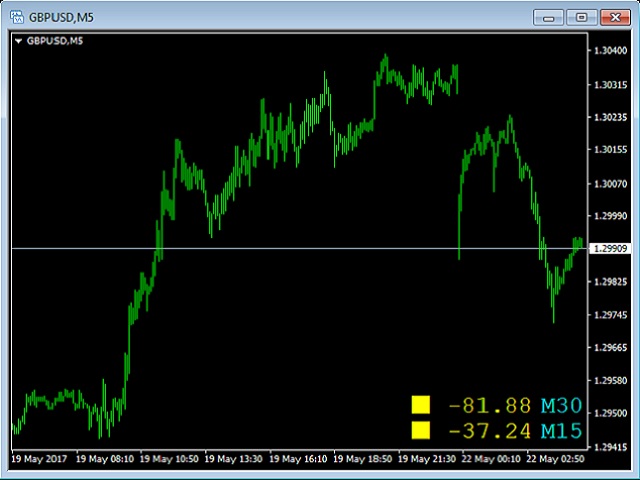
An yellow square is representing a line graph between boundaries.
Input parameters
- Period1 - CCI period for TF1.
- appPrice1 - CCI applied price for TF1.
- Period2 - CCI period for TF2.
- appPrice2 - CCI applied price for TF2.
- LevelUp - CCI Upper Level boundary.
- LevelDn - CCI Lower Level boundary.
- corner - The Chart corner to which a text-message Is attached.
This indicator could be used on M1, M5, M15, M30, H1, H4 and D1 TFs.