This indicator is designed for plotting the linear regression channel. For convenience, it has multiple operation modes and drawing of data from the selected timeframe.
Input parameters
- Price - the price to be used for calculation and plotting the upper and lower boundaries of the channel
- PriceHighLow - the value of bar's High and Low
- PriceOpenClose - the value of bar's Open and Close
- Mode - indicator operation mode
- Static - the linear regression channel is always plotted starting from BarStart and stops at BarEnd = 0, the channel cannot be modified by dragging the line
- Dynamic - the linear regression channel is plotted starting from BarStart and stops at BarEnd = 0. When a new bar appears on the chart, the channel increases in size, the beginning of the channel can be modified by dragging the line
- History - the linear regression channel is plotted starting from BarStart and stops at BarEnd, the beginning and end of the channel can be modified by dragging the line
- Back - enable/disable the display of the channel in the background
- MainLine - show/hide the main line of the channel
- Selectable - \enable/disable the ability to select the channel lines
- Ray - show/hide the rays of lines
- Refresh - enable/disable updating the input parameters of the indicator when they are modified, when the terminal is shut down or when the timeframe of symbol is changed
- TimeFrame - the linear regression channel is plotted using the data from this timeframe; works only for Mode = Static
- BarStart - the number of the bar to plot the linear regression channel
- BarEnd - the number of the bar where the linear regression channel stops; works only for Mode = History; for other modes, the value is always 0
- LINE_PARAMETERS\BASIC_LINES\POSSIBLE LINES - text separators, for easier viewing of the indicator parameters, they do not affect the operation of the indicator
- Value*Line* - the value of the line deviation from the main line, ranges from -1 (lower limit) to 1 (upper limit); for example: -0.25, 0.5, etc. To hide the line, set any value not in the range of (-1; 1), for example: 4.
- Color*Line* - line color
- Style*Line* - line style
- Width*Line* - line width
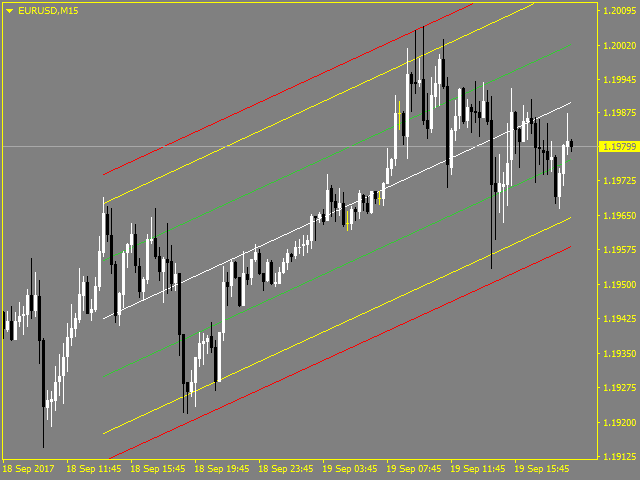
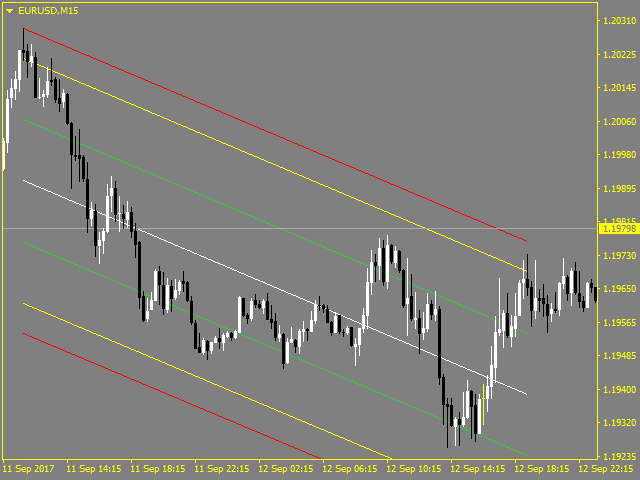
By default, the indicator plots the main line of the linear regression, the upper and lower boundaries of the channel, as well as 4 additional lines for separation into zones. In addition, up to 14 lines can be enabled.
Mode Static is more suitable for price monitoring and analysis in a static period (for example: 50, 100, 150) separately or together with other indicators.
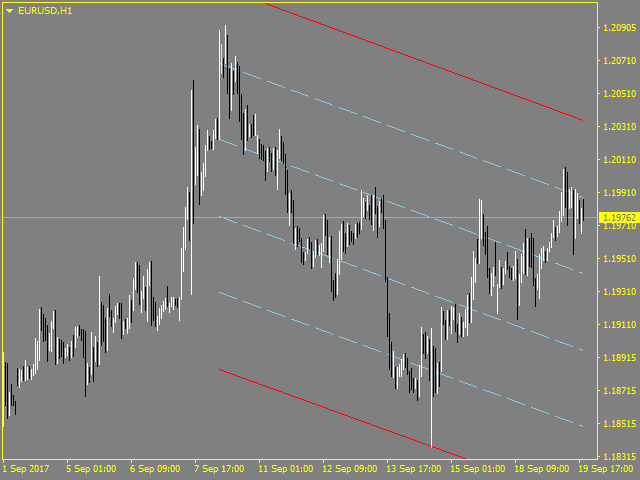
Mode Dynamic is more suitable for determining the levels of a probable price reversal, by moving the lines of the linear regression channel to a local Low/High.
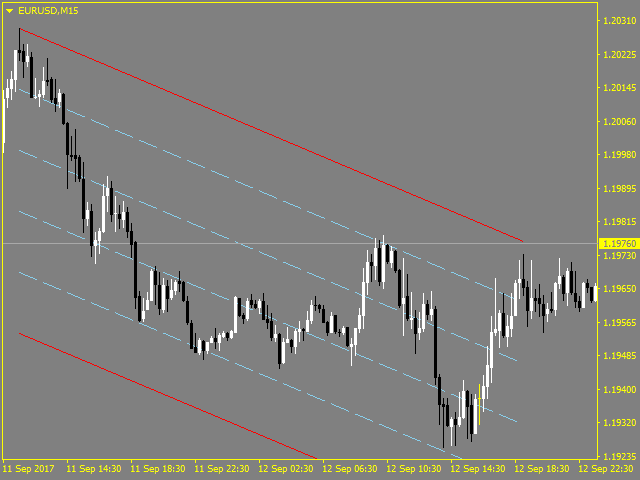
Mode History is more suitable for analyzing the price movements on history data, by moving the entire linear regression channel to the area of interest.