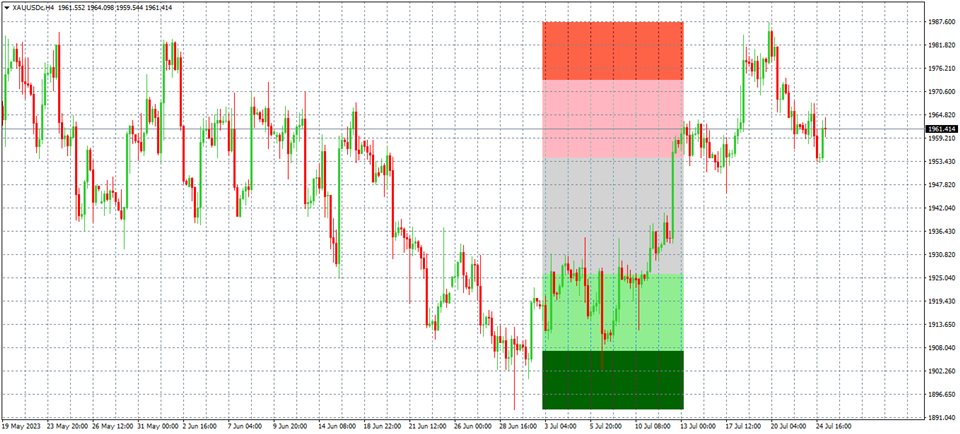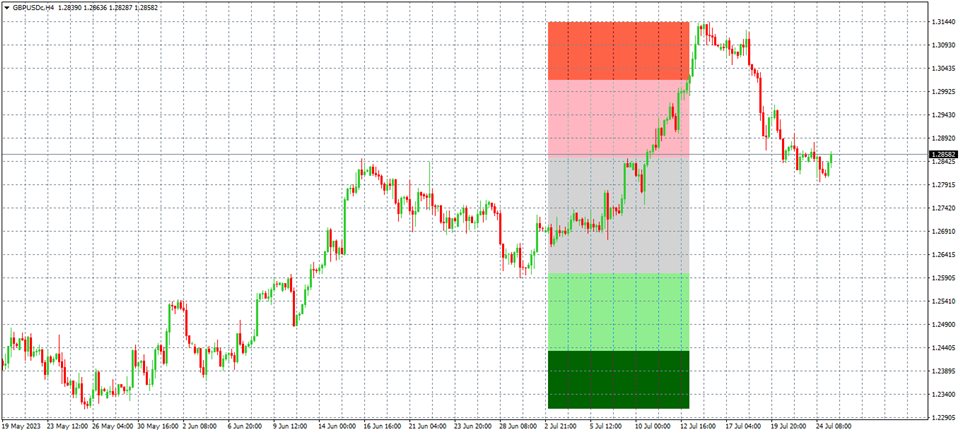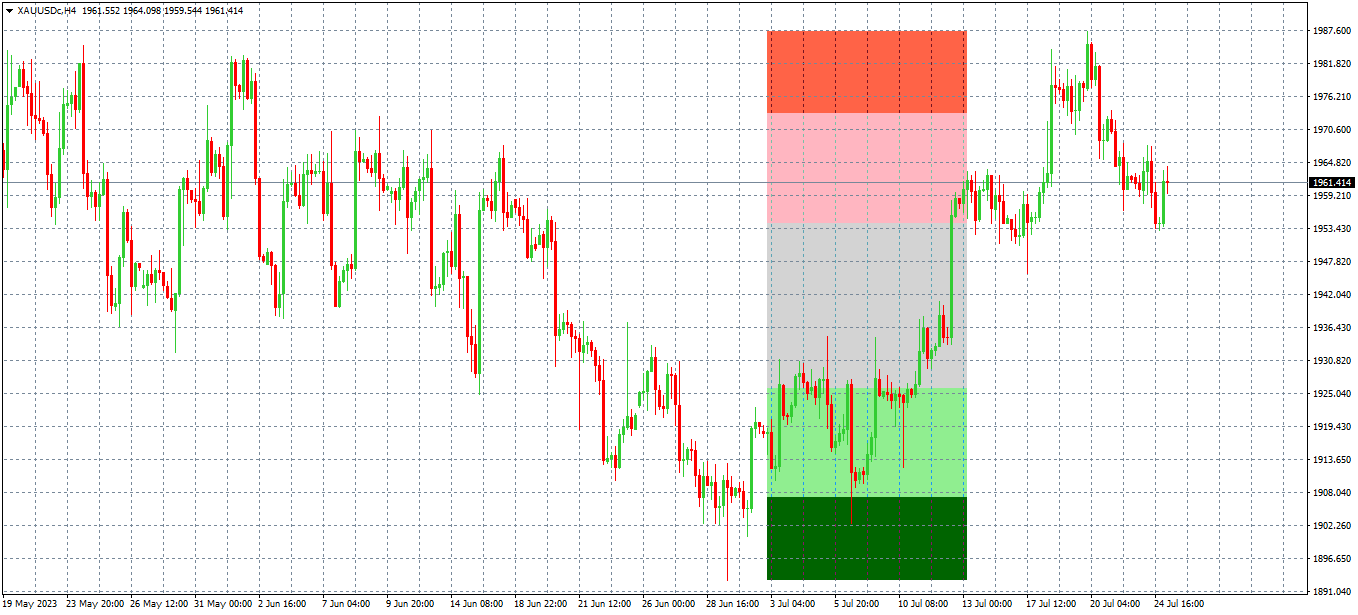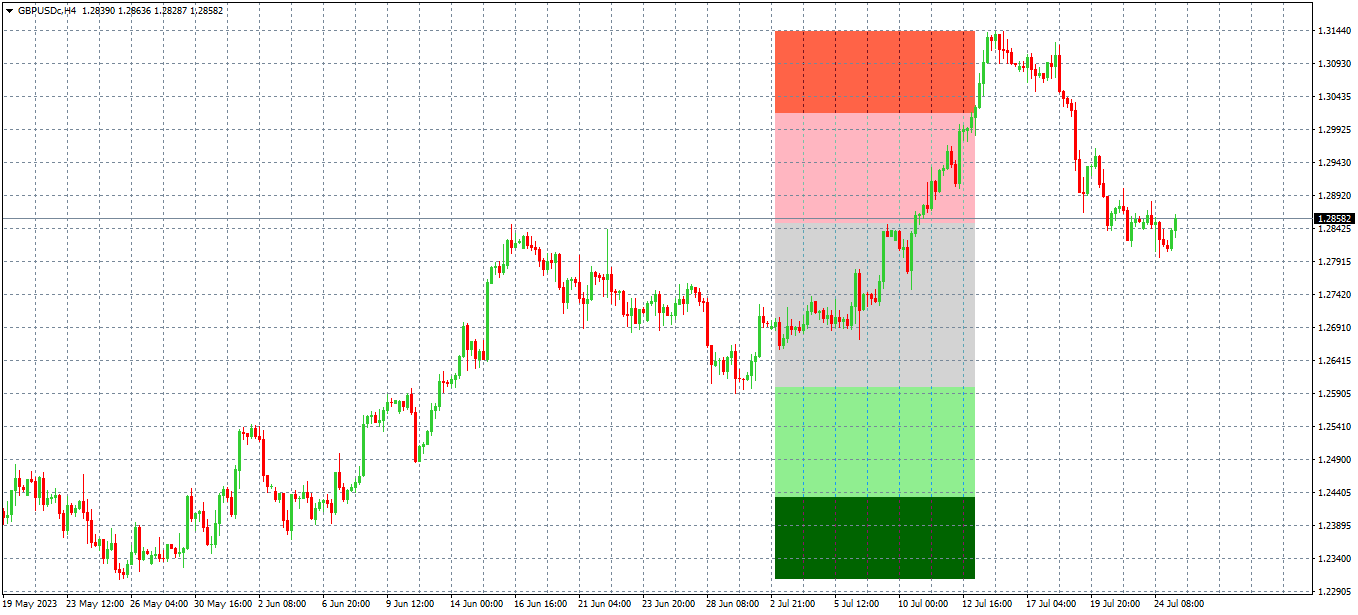
This Indicator is based on Fibonacci levels and draws Buy & Sell Areas. Buy areas are defined in green color (light green & dark green) while Sell areas are defined in red color (light red pink and darker color) Rectangles to easily know that whether price is in buy area or sell area. If price is in gray area, wait for price to come in to your desired area.
You can use on any Forex Pairs.
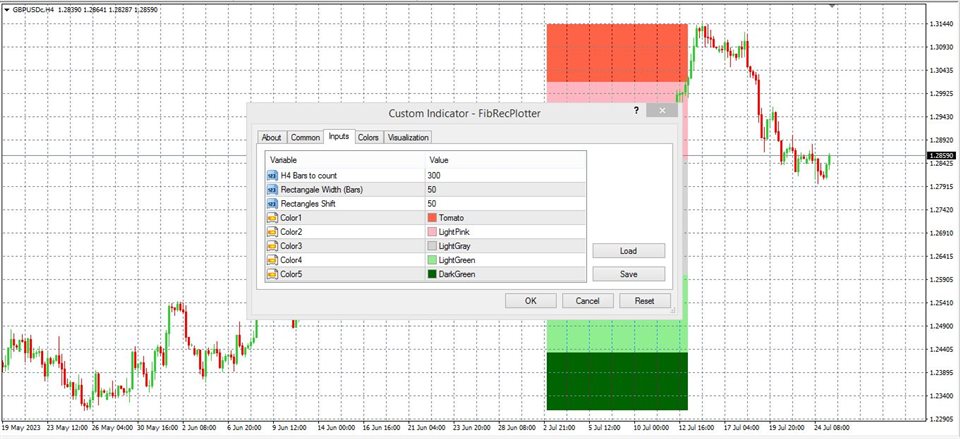
This indicator calculates on the basis of h4 timeframe no matter what time frame you have selected, its calculations will not affect. You can change bars in count and even shift the rectangles forwards or backwards as per your convenience.
Please remember, If price is going in one direction after strong fundamental impulse, don't trade counter trend until clear H4 candles are formed against trend. How ever if there is no fundamental moves, then this indicator will help you making your trade decisions.
Thanks.