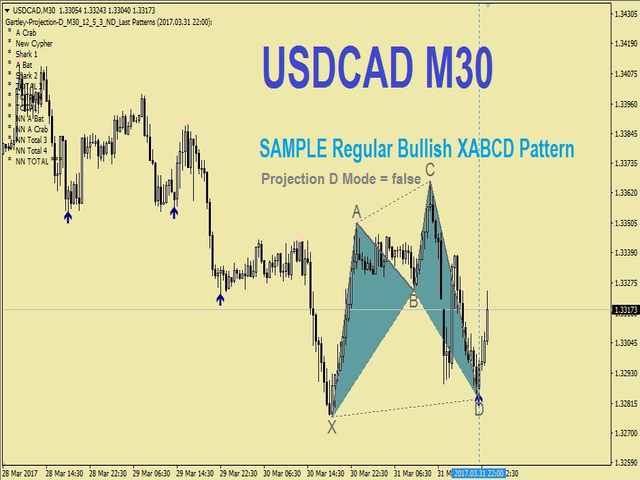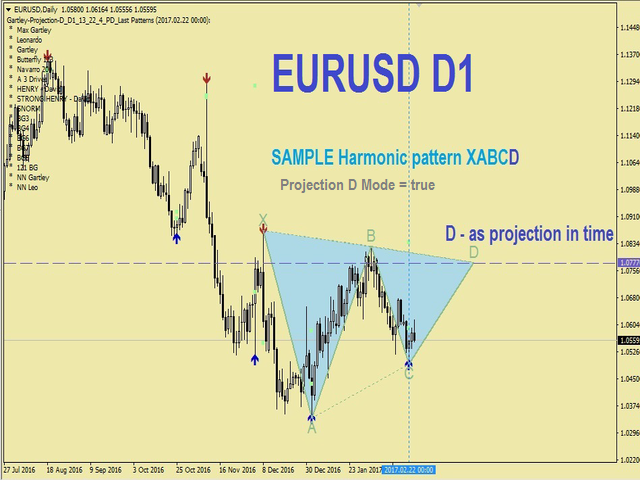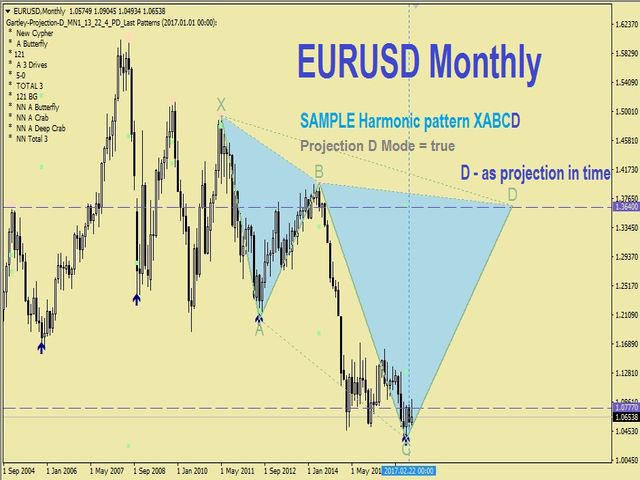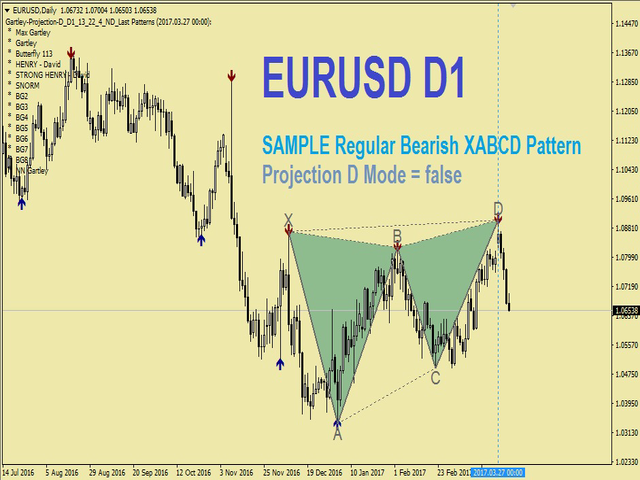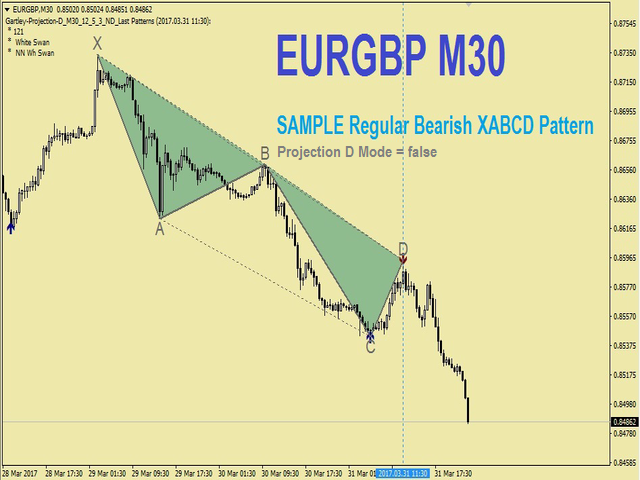
The indicator identifies the harmonic patterns (XABCD) according to developments of H.M.Gartley ( "Profits in the Stock Market" , 1935г).
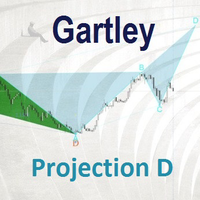
It projects D-point as a point in the perspective projection (specify ProjectionD_Mode = true in the settings).
Does not redraw. When a bar of the working timeframe closes, if the identified pattern point has not moved during Patterns_Fractal_Bars bars, an arrow appears on the chart (in the direction of the expected price movement). From this moment on, the arrow permanently remains on the chart.
2-3 and more arrows in a row - this is changing market conditions, NOT repaint/redraw (must not switch time-frames back and forth).
NOTE: 2-3 and more arrows in a row - this is changing market conditions, NOT redraw.The total number of patterns is 85 (including Gartley-222 and Gartley-222WS , the full list is available in the Comments section). Only the latest identified pattern is filled with a solid color among all identified patterns.
Parameters
- DrawPatterns (true/false) - draw a pattern with a solid color
- ProjectionD_Mode (true/false) - mode for defining the D-point as a projection in perspective
- Patterns_Fractal_Bars - the number of the working timeframe bars, during which the latest identified pattern point must remain fixed for it to be considered a formed fractal (an arrow appears on the chart)
- Patterns_Deviation - allowed percentage deviation from the reference values of side proportions in a pattern (allowed value range)
- Patterns_XA_MinLength_Bars - the minimum allowed number of bars on the initial segment XA
- Patterns_XA_MinHeight_Points - the minimum allowed size of the initial segment XA in points
- ZigZag_Depth - parameter of the ZigZag indicator
- ZigZag_Deviation - parameter of the ZigZag indicator
- ZigZag_Backstep - parameter of the ZigZag indicator
- ShowInfo (true/false) - display the list of identified patterns at the left side of the chart
- PrintInfo (true/false) - print the information to th log