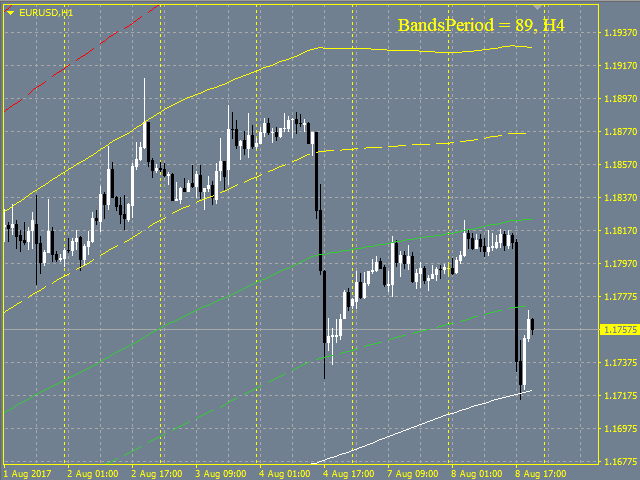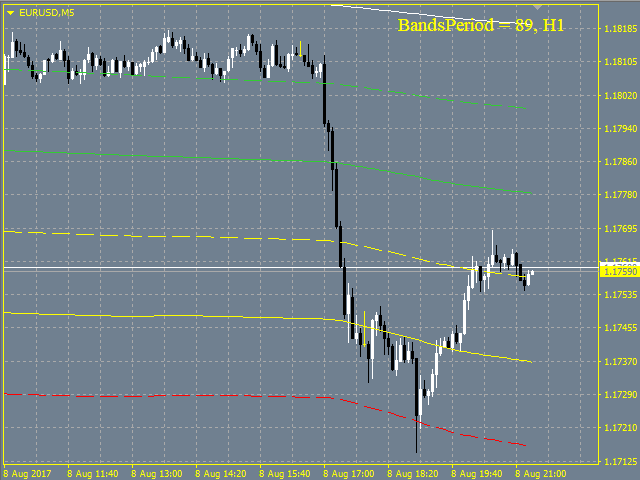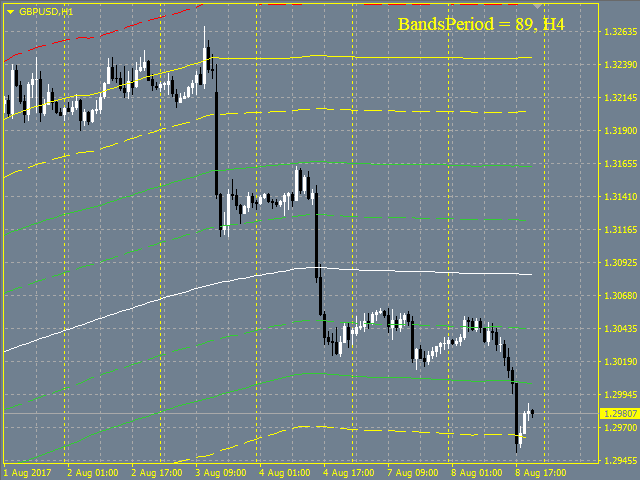
This indicator is based of the well-known Bollinger Bands indicator and provides for an easier operation with BB. It allows drawing up to 3 Bollinger channels and thus simplifies navigation in the list of indicators. Also it allows plotting Bollinger Bands of different timeframes, for example: draw BB on M5 timeframe with parameters: Period = 100, Timeframe = H1.
Inputs Value
- Mode - choosing different modes of working with the indicator
- StaticTimeFrame - the indicator draws Bollinger Bands from the specified timeframe
- NextTimeFrame - the indicator draws Bollinger Bands of the next higher timeframe
- TimeFrame - choose a timeframe to draw Bollinger Bands if Mode = StaticTimeFrame, otherwise the parameter is ignored
- Label - show/hide the current period and timeframe of Bollinger Bands, by default it is shown in the upper right corner of the window
- BandsPeriod - period for drawing Bollinger Bands
- MainBand_0 - show/hide the main Bollinger Bands line
- BandsDeviation_1, BandsDeviation_2, BandsDeviation_3 - deviation of BollingerBands, the line is hidden if set to 0.0
- BandsShift - shift of Bollinger Bands
- BandsAppliedPrice - price used for calculating and drawing Bollinger Bands
- Label_X, Label_Y - coordinates of the label showing the current BB period and timeframe
The indicator does not support the drawing of values from the MN1 timeframe. Also, there may not be enough history data, e.g. if you draw Bollinger Bands with parameters: Period = 100, Timeframe = D1 on M1.


