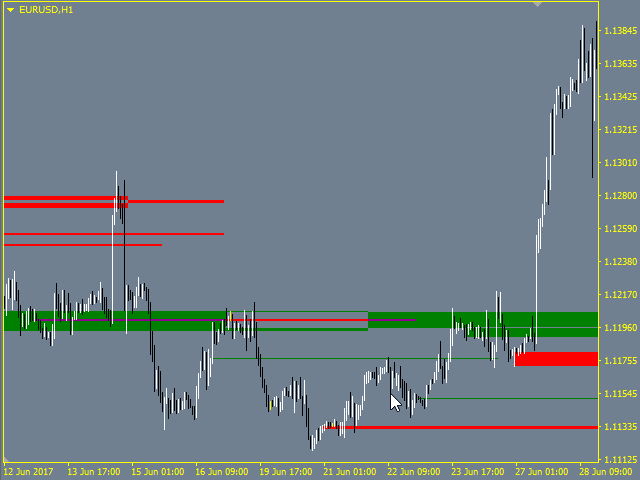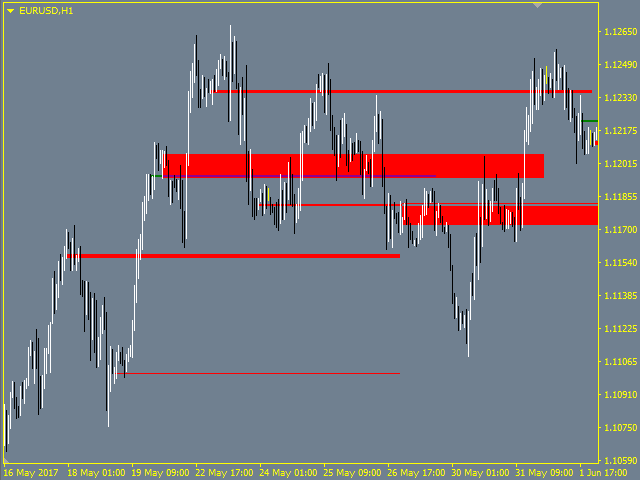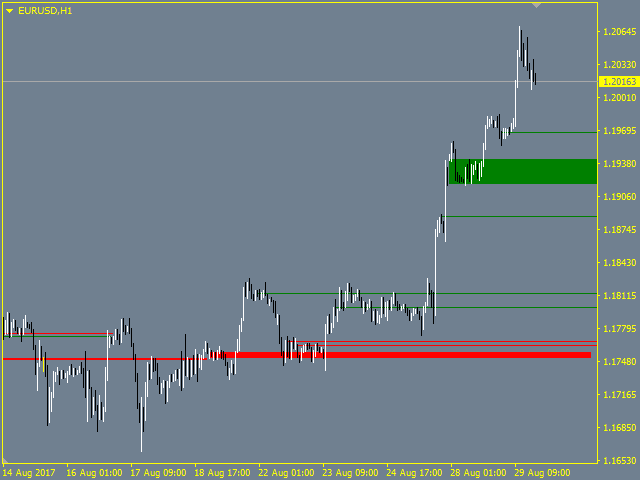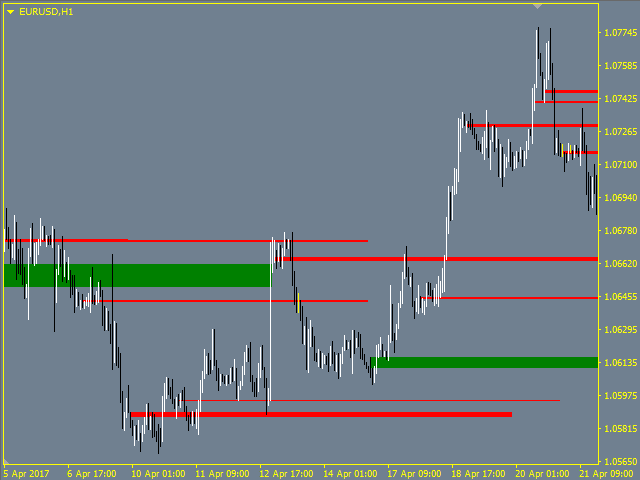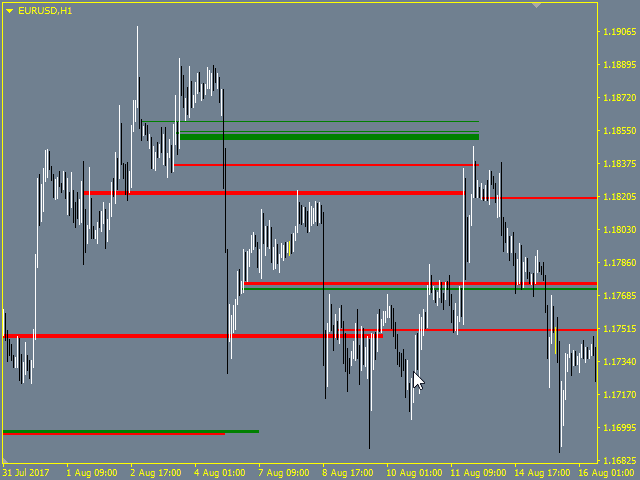
The indicator finds and visualizes price gaps, which often can be used as support and resistance levels. It can display levels from different timeframes on one chart.
Inputs Value
- Label - show/hide the timeframe of constructed levels
- TimeFrame - select timeframe to draw levels from
- DrawRangeDay - the length of the level in days
- DrawRangeHour - the length of the level in hours
- GapSizeForDrawing - a level will be drawn if gap is equal to or larger than this level in points
- CountDays - the number of days to search or price gaps
- GAP_UP - the color of the upper gap
- GAP_DOWN - the color of the lower gap
- Label_X, Label_Y - coordinates of the label showing the timeframe of levels