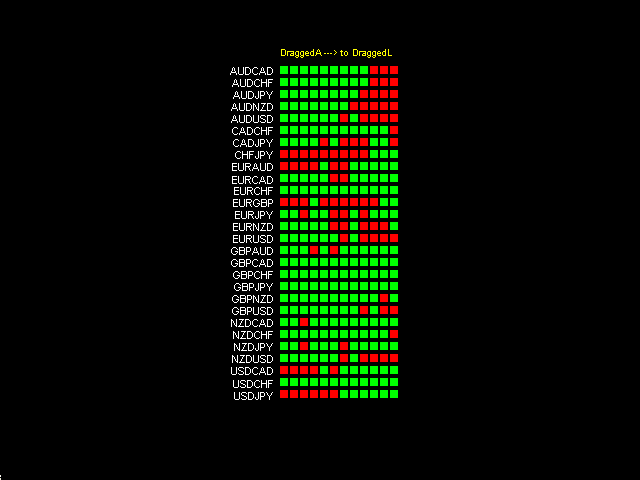
Olimpia Dragged Trends!
- This dashboard indicator is a visual tool which recognizes dragged trends of 28 pairs in a easy-to-read histogram.
- You will see a group of squares indicating the sum and average values of trends of the last "...." minutes for each square from L to A in a dragged way.
- "Dragged Way" means that regardless the hour of the day or opened or closed candle it always shows the present and the pastinformation.
- You can configure a sequence of numbers with values between 1 minute to 2000 minutes back. (Fibonacci sequence of numbers is set by default)
- Squares in RED mean short trends, in GREEN squares mean long trends.
- This tool is based on average pips from dragged minutes to the present. No indicators or any other tools are used for the calculation in this indicator.
- Whatever your trading style, it's very important to know if the price move is a small isolated one or if the correlated pairs move all together.
- The more similar pairs agree, the more the move is real and good for catching some pips.
- After observing this tool, you will be able to define which similar pairs move together for a strong move.
This tool doesn't show an entry point. It is a unique chart that shows all pairs and the current price move in a dragged way.Indicator Parameters
Where to add the Dash in the chart:
- horizontally: x position of the dashboard
- vertically: y position of the dashboard.
Please configure the minutes back for dragged trends:
From the right (DraggedL) to the left (DraggedA).
Default values with a Fibonacci sequence of minutes back (Just recommended to use like that)
- DraggedL = 8
- DraggedK = 13
- DraggedJ = 21
- DraggedI = 34
- DraggedH = 55
- DraggedG = 89
- DraggedF = 144
- DraggedE = 233
- DraggedD = 377
- DraggedC = 610
- DraggedB = 987
- DraggedA = 1597