WPR by Profile, or WPR for Professionals
- Geo_WprPro is one of the well-known currency profile indicators. It simultaneously displays two WPR indicators with different parameters in the matrix form on all timeframes of multiple currency pairs forming the currency profile .
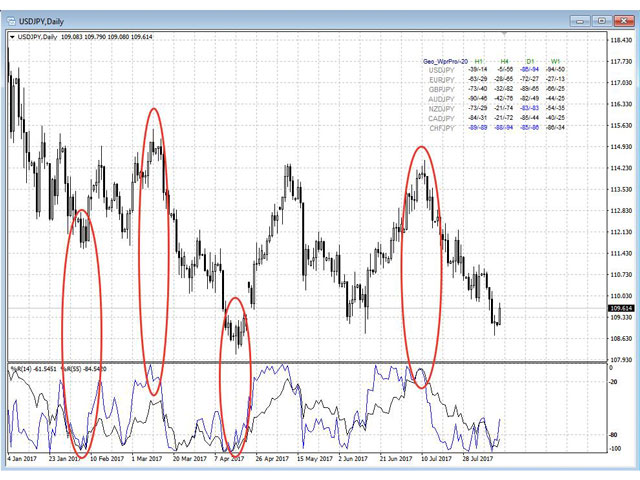
- As follows from the description, " WPR is a leading indicator that often goes ahead of the price chart. The oscillator frequently reaches extreme values before the price reversal as if anticipating that event: it almost always forms a High and turns down a few days before the price reaches the High and turns down, and vice versa ".
- Thus, you can see if the selected instrument and other currency pairs with this instrument are ready for reversal , without switching timeframes, while tracking two indicators with different calculation periods simultaneously allows you to understand the price intentions both in the immediate and distant future.
- The indicator is perfect for scalpers, intraday and medium-term traders since it features an excellent market entry accuracy based on the synthesis of signals from different timeframes and other currency pairs.
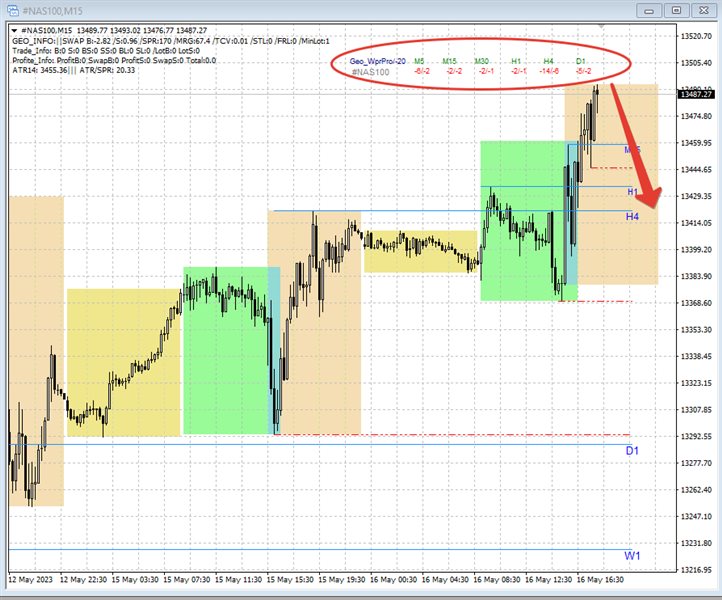
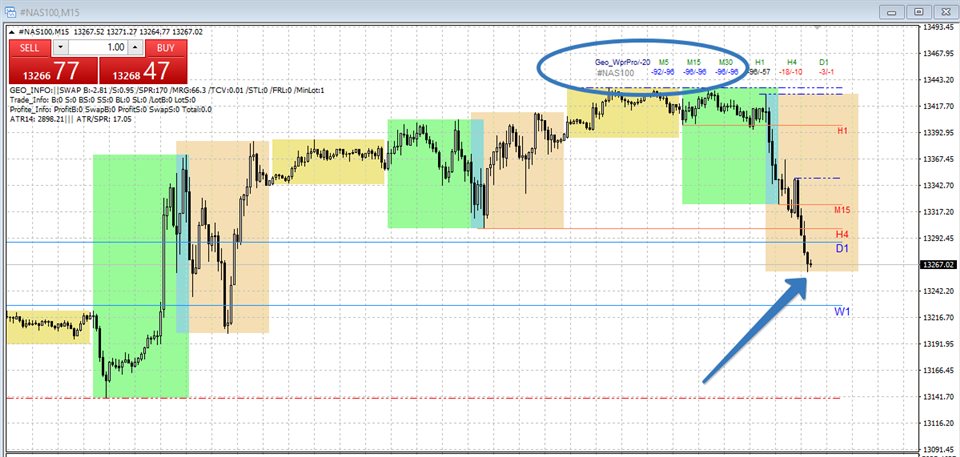
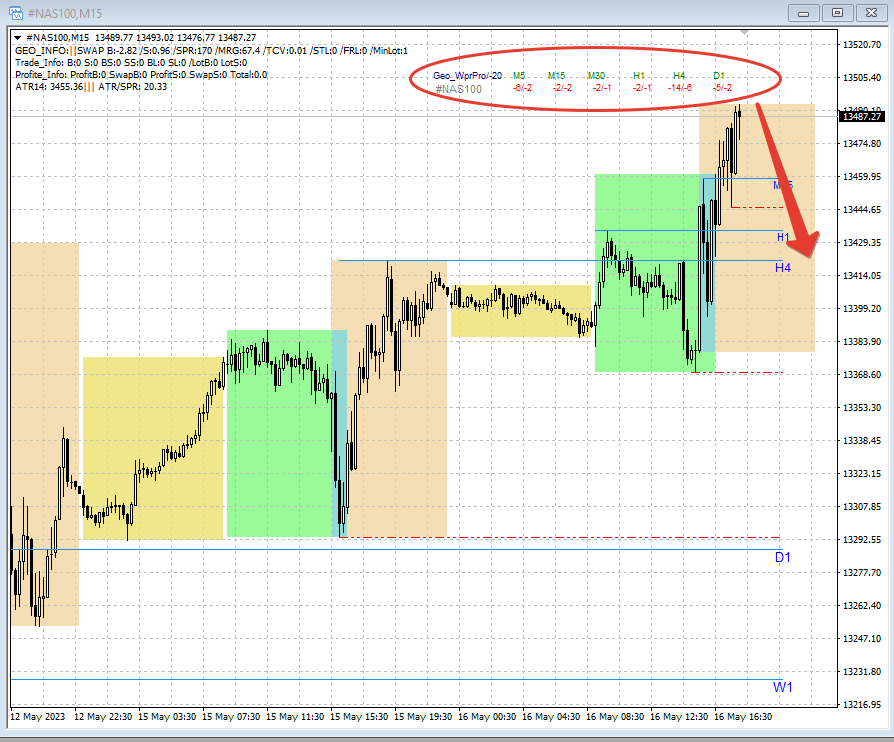
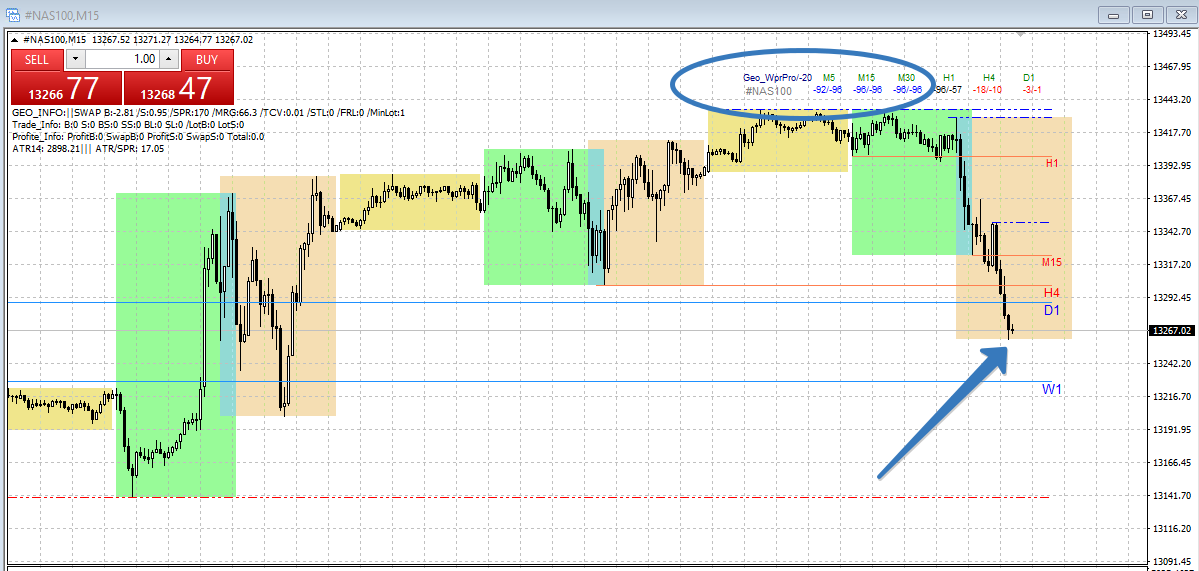
- If the indicator lines go beyond the threshold values (-20/-80), the font color changes to blue/red accordingly signaling of a possible reversal. The threshold value can be changed in the parameters.
- If the signals from different timeframes and along the entire currency profile match each other, the signal is amplified considerably .
- The indicator also shows the upcoming market entry opportunity.
- Since the indicator displays and analyzes the instrument profile (simultaneous display of a selected instrument on various pairs), the indicator works with a set of currency pairs the instrument profile can be compiled of. All instruments that should be used to build a profile are set the same way as in the "Market Watch" in the AllSymbols input (comma separated, no spaces). The list can be changed/added by a user .
Parameters
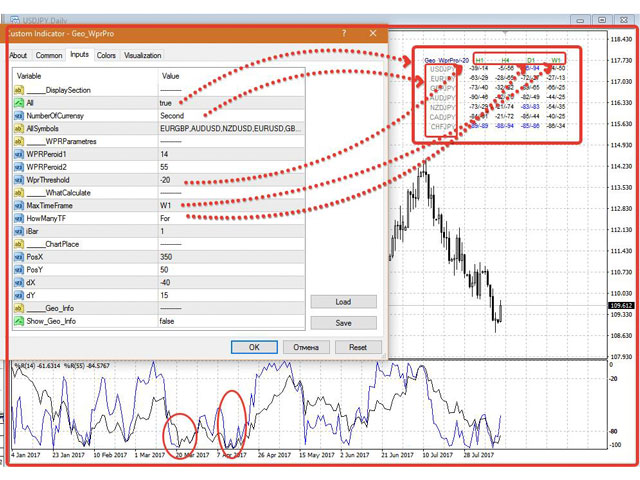
Display Section - how to display
- ALL - display as a matrix ( True ) or only for one instrument as a line ( False ).
- NumberOfCurrensy - First or Second - select currency in a pair the profile is built for ( First / Second).
- AllSymbols = " EURGBP, AUDUSD, NZDUSD, EURUSD, GBPUSD, USDJPY, USDCAD, USDCHF, EURJPY, EURCAD, EURCHF, GBPJPY, GBPCAD, GBPCHF, AUDJPY, NZDJPY, AUDCAD, AUDCHF, NZDCAD, NZDCHF, CADJPY, CADCHF, CHFJPY, AUDNZD, EURAUD, GBPAUD, EURNZD, GBPNZD, XAUUSD, XAUEUR, XAUAUD, XAUGBP, XAUCHF, EURPLN"; - list of all symbols participating in building the profile.
WPRParametres - WPR parameters
- WPRPeriod1 - first indicator period.
- WPRPeriod2 - second indicator period.
- WprThreshold - threshold for changing color for overbought/oversold conditions (usually -20).
WhatCalculate - what to calculate
- MaxTimeFrame - maximum timeframe, on which the calculation is performed and which is to be displayed (M1, M5, M15, M30, H1, H4, D1, W1, MN)
- HowManyTF - how many timeframes are to be calculated and displayed (starting with the highest one set in MaxTimeFrame ).
- iBar - bar index for calculation, = 0 - current bar , =1 - closed bar. The values of 2 , 3 , etc. can be used to display with a shift to the appropriate number of bars back into history. I use 1.
ChartPlace - matrix location parameters.
- PosX - X coordinate for locating the matrix on the chart. I use 350.
- PosY - Y coordinate for locating the matrix on the chart. I use 50. The matrix is placed in the upper right corner of the chart.
- dX - distance between columns.
- dY - distance between rows.
Geo_Info - display main data on a symbol like in the Geo_Info indicator.
- Show_Geo_Info - True or False - display main data on the instrument in the left corner as a line, like in Geo_Info .