CS Info [Currency Strength Information]
CS Info is the real-time MTF calculation of 28/34 symbols for the strength of 8 currencies/XAU - AUD, CAD, CHF, EUR, GBP, JPY, NZD, USD and XAU. It analyses the trend or momentum/strength of all 8 currencies and XAU to determine high probability currency combinations and trading opportunities.
Key Features
- Floating position - with click on Control to select and move
- Mode A/Mode B for presentation of CS Calculation
- FX or FX/XAU to change FX or FX/XAU
- Active - for better focus on current symbol
- History - to display CS history
- Real-time multi-timeframe calculation from 28/34 symbols for strength of 8 currencies and XAU
- 4 calculation sets [Multi-timeframe/Many candles]
- Time frame
- Candle count
- Easy to change inputs of each CS calculation sets on screen
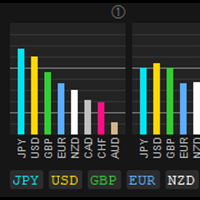
- Easy to use and determine the momentum or strength with graphic presentation
- Signal Strength/Weakness with different color [based on difference in strength] for each symbol's calculation set
- Directional signal momentum
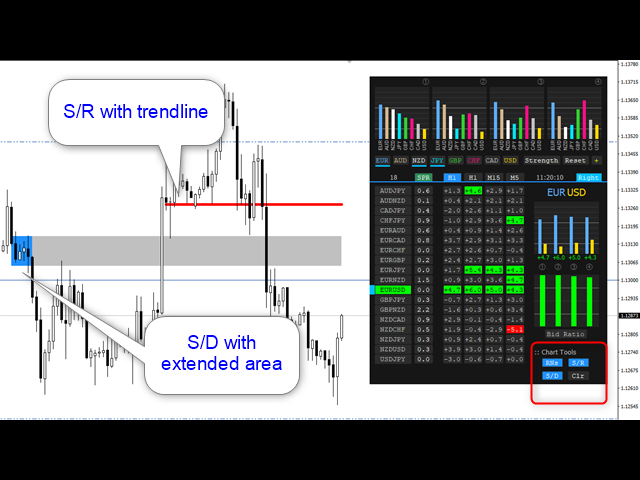
- Chart tools
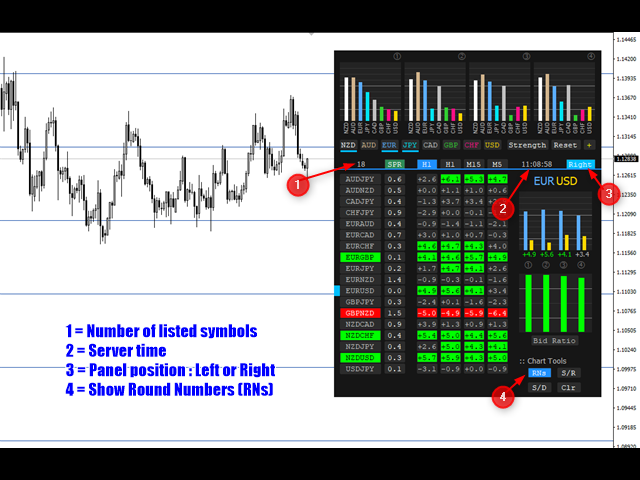
- RNs - To show Round Numbers on charts
- S/R - To move Support/Resistance line with mouse move
- S/D - To draw supply/demand zone with extended area
- Easy to draw S/R line with one-click of Trendline object
How to trade with CS Info
Use CS Info to determine the strength of 8 currencies/XAU and combine strength with difference in strength between base currency and quote currency for trading opportunity.
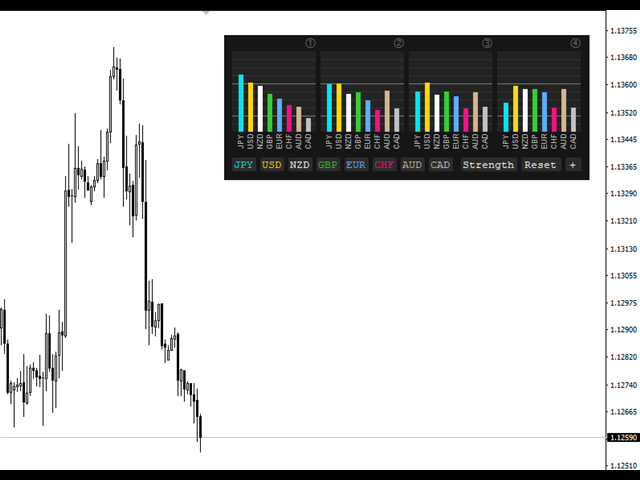
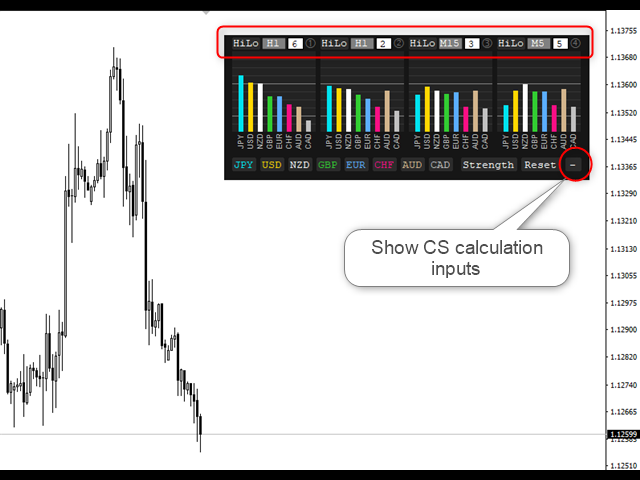
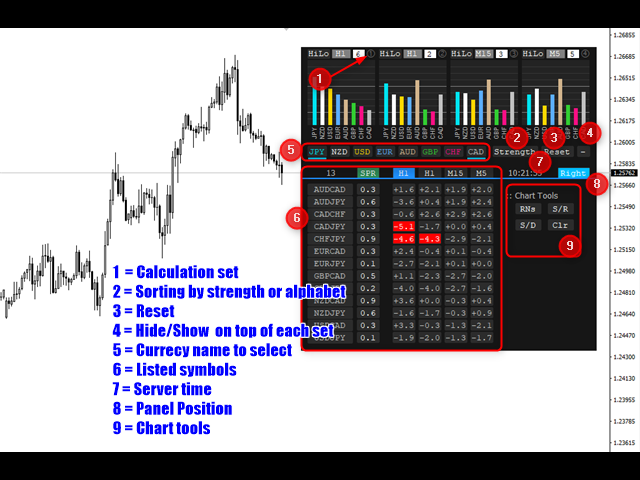
- Use 4 top CS calculation sets to determine the strength of 8 currencies.
- On top of each calculation set,
- Click HiLo to show calculation set on chart
- Click Timeframe to change
- Click candle count to put new number and enter
- Click on each currency to list related symbols
- Click on "Reset" to reset all customized calculation inputs to defaults in Indicator settings
- Click on "-" to hide all calculation inputs on top of each set
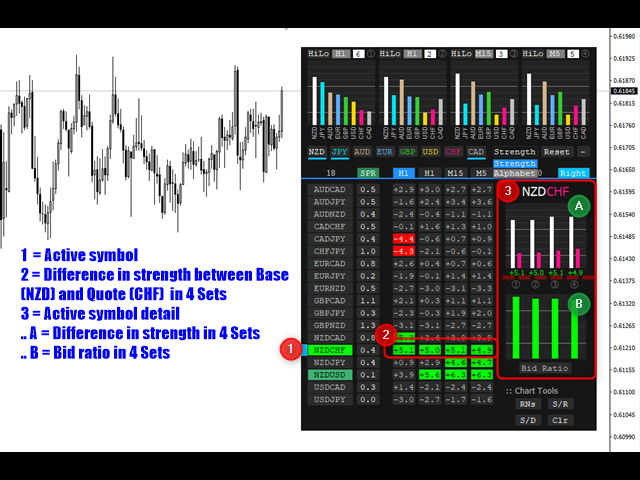
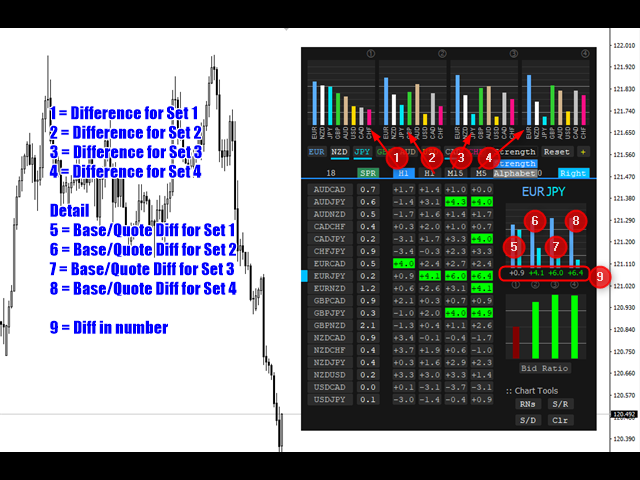
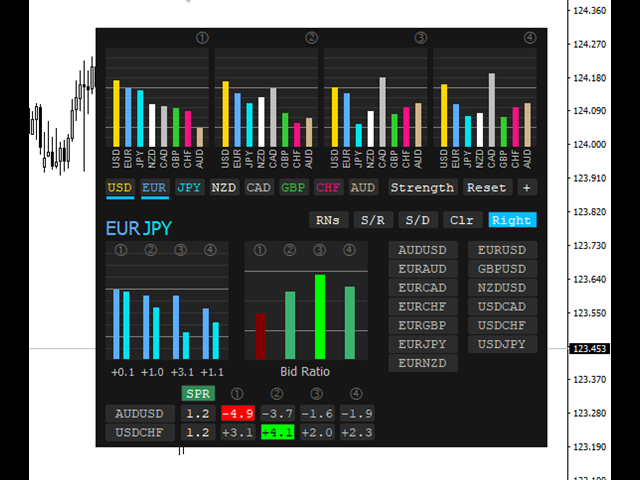
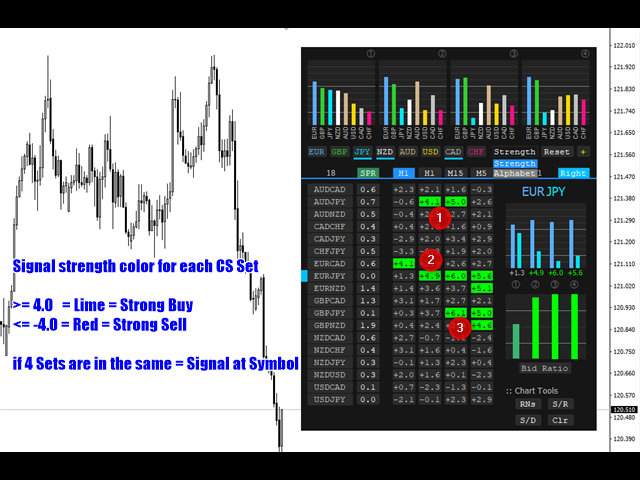
- Find symbols with difference in strength between Base currency and Quote currency in 4 calculation sets. The symbol's signal color of each set changes with difference in strength as defined in indicator settings [Difference in Threshold = 4]. The number can be changed.
- The signal/trading probability is the strongest when the 4 sets are in the same direction [same color]. The calculation set with the higher timeframe and candle counts must be prioritized.
- Click on each symbol to find more detail
- On right, only strength of Base currency and Quote currency will be shown to compare 4 sets.
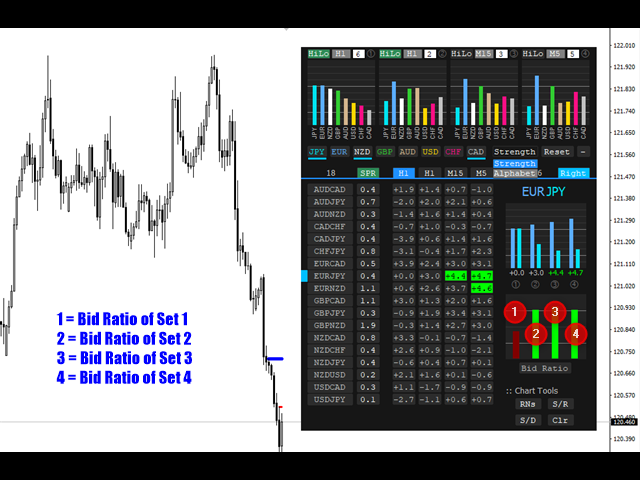
- On right, Bid ratio [The bid price is relative to the high/low of each set] will be shown.
- You can use Chart tools such as
- RNs to draw Round Numbers on charts
- S/R to move S/R line with mouse move
- S/D to draw Supply/Demand with rectangle object
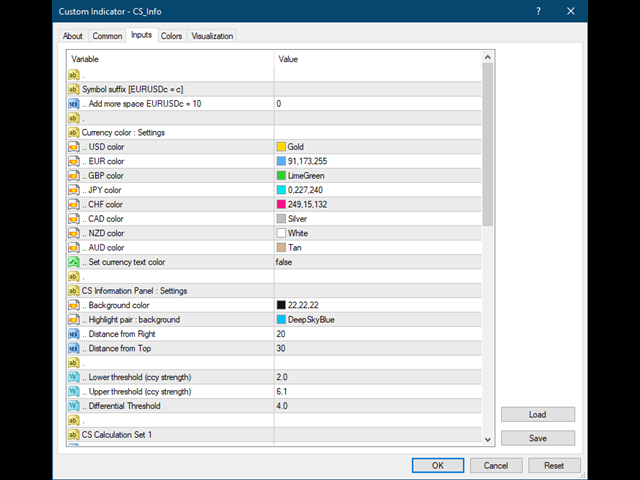
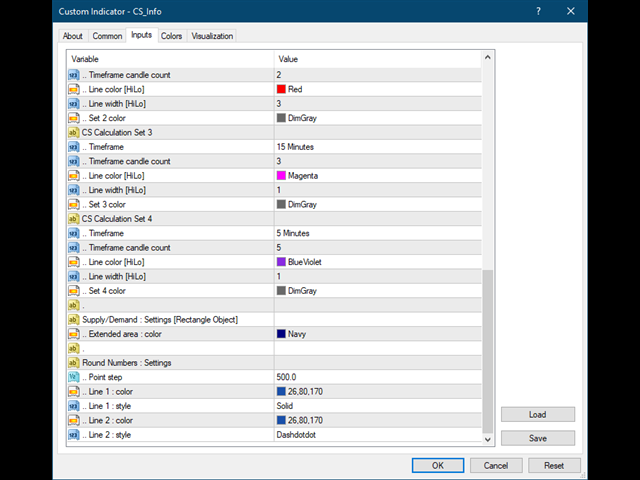
Indicator parameters
Basic parameters are required. But most of them can be changed on screen.
- Symbol suffix - Symbol suffix
- Settings : Currency/Gold Strength
- Lower threshold
- Upper threshold
- Differential Threshold
- CS Calculation Set 1-4 : Settings [These settings can be changed directly on chart]
- Timeframe
- Candle count
- H/L line color
- Settings : Currency color
- Settings : Active
- Active Base currency color
- Active Quote currency color
- Settings : CS History
- CS History : Moving UP
- CS History : Moving DOWN
- Settings : RNs [ Round Numbers ] [00 50 20 80]
- Show 00/50 Line levels
- Show 00/50 Label levels
- 00 level label color
- 00 level line color
- 00 line width
- 00 line style
- Settings : S/D [ Draw rectangle as Supply/Demand base]
- Supply zone color
- Demand zone color