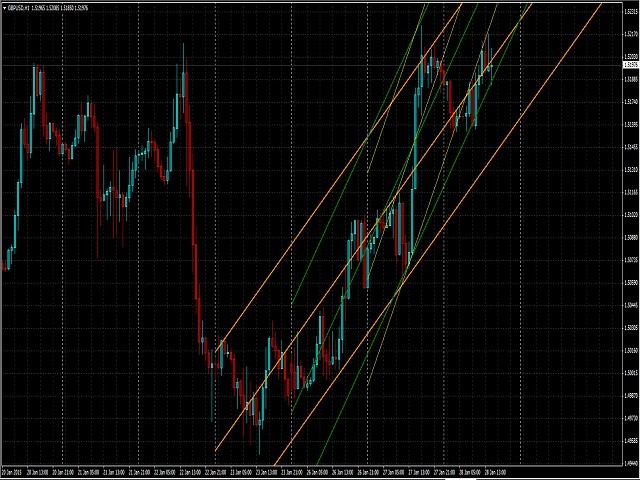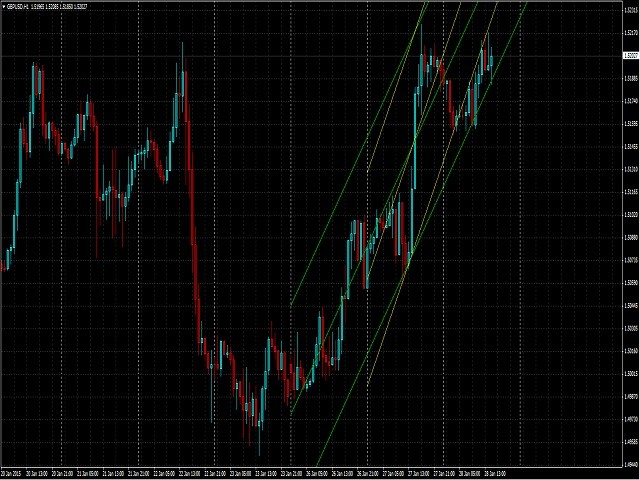
The indicator automatically draws up to five different regression channels.
The product draws the channels for the previous major periods.
For example :
Indicator Chart Drawing Period
M1
D1
M5 D1
M15 D1 M30 D1 H1 D1 H4 W1 It updates itself at the beginning of the major period (ex.: D1 or W1).
The periods are in the major period domain.
For example : if the indicator is put on H1 chart, the period of 1 means 1 day on the chart.