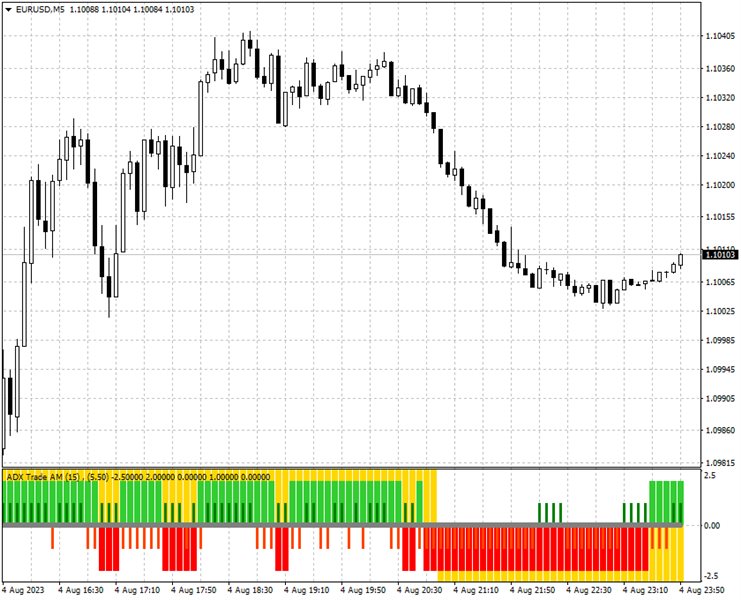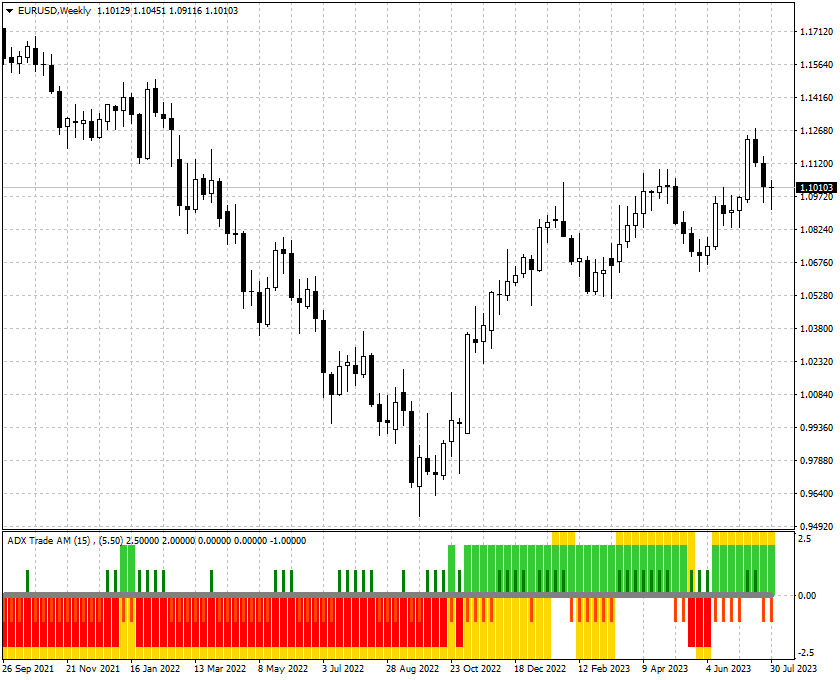
The indicator allows you to simplify the interpretation of signals produced by the classical ADX indicator.
The position of the thick bars of the histogram relative to zero and the histogram coloring indicate the direction of price movement determined by the intersection of DI+ / DI-. The position of the thin bars of the histogram relative to zero and the color indicate the strength of the price movement.
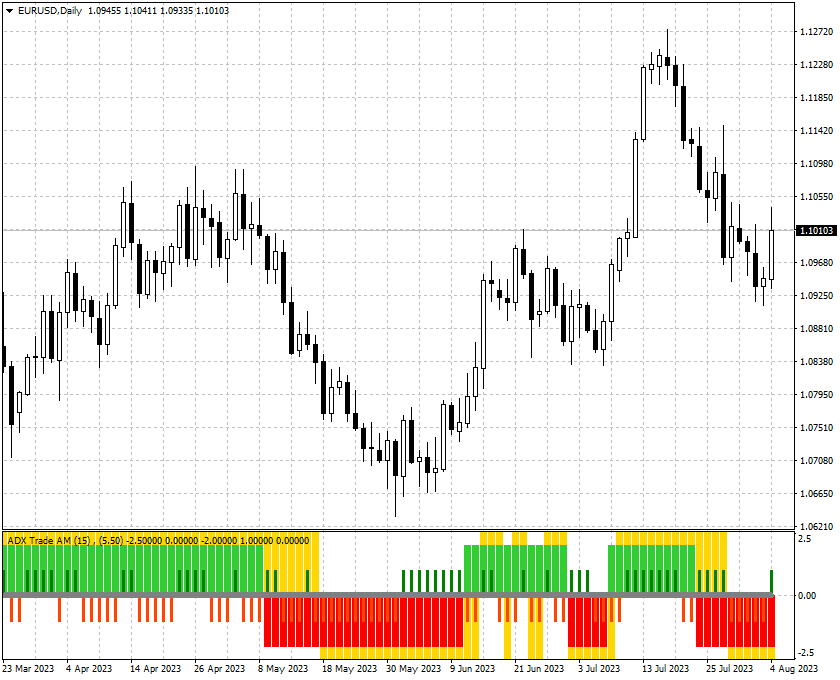
- A buy signal is generated when the price moves above the high of the last fully formed bar, on which the thick histogram bar is above zero and the previous thick bar was below zero.
- A sell signal is generated when the price moves below the low of the last fully formed bar, on which the thick histogram bar is below zero and the previous thick bar was above zero.
How to use:
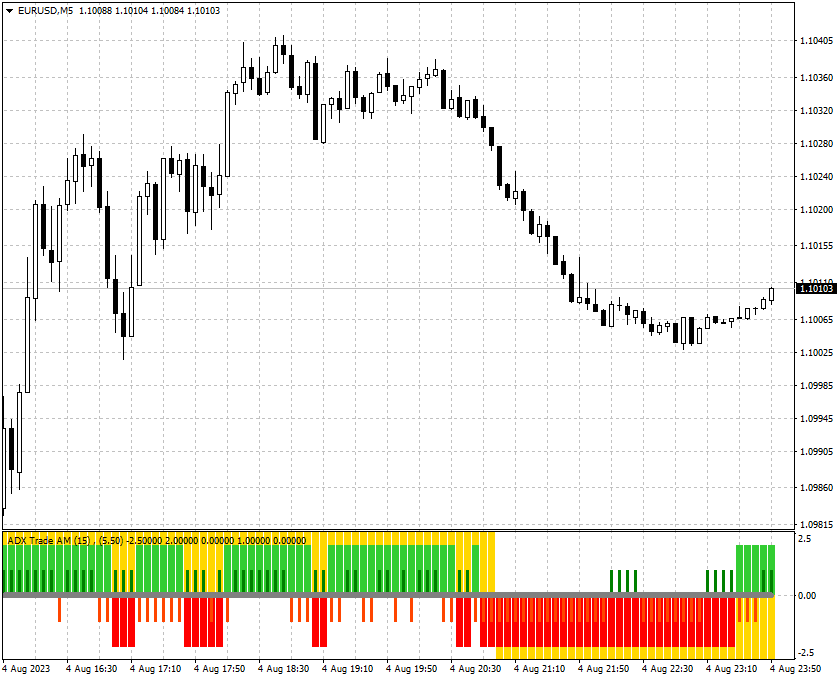
When the +DI and -DI intersection signal appears, set a pending buy ore sell order at the high or low (including spread) of the bar, on which the signal occurred.
When ADX falls and there is an open position, set a pending order to close the position at the high or low (including spread) of the bar, on which the signal occurred.
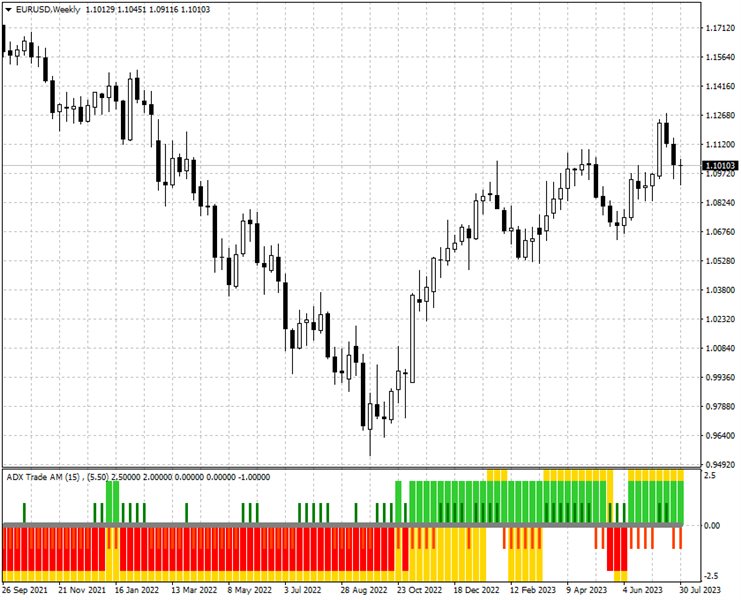
The use of ADX rise/fall signal in the long-term trend direction for opening positions can also be effective.