Description
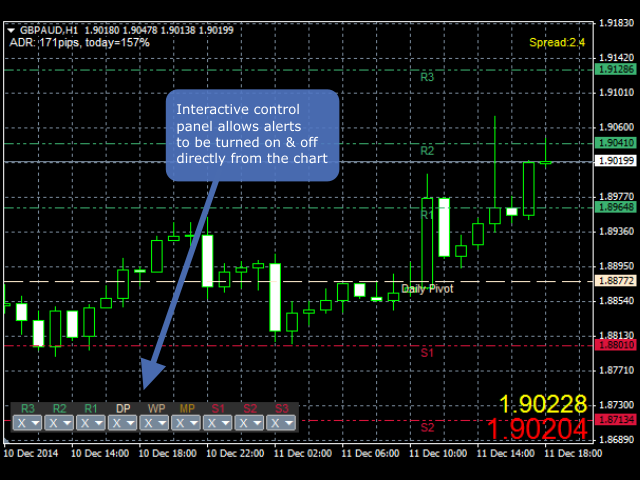
The product draws lines on the chart to show daily support, resistance and pivot plus weekly and monthly pivot. An alert can be set when the price reaches one of the lines or the price closes above/below it. This can be useful for both entry and exit. The alerts can be controlled interactively directly from the chart.
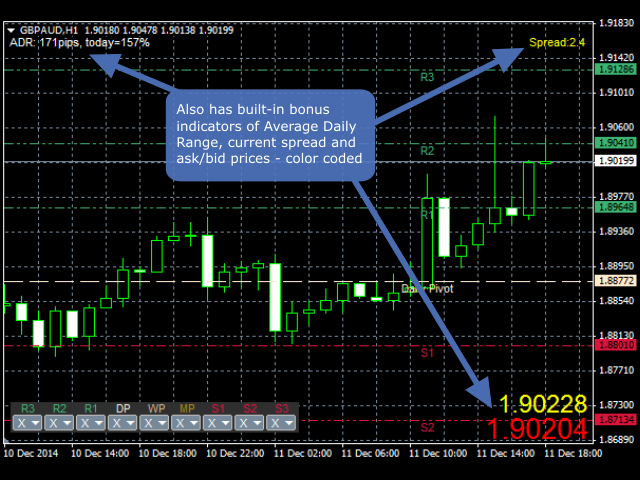
The product also includes bonus indicators of Average Daily Range (or Average True Range - configurable), current spread and ask/bid prices in large text, color coded as price changes.
Usage
Pivots and support/resistance are important prices for considering entry if the previous candle has closed above/below the line, or in terms of exit, if the price has reached the line. The reason being is that the price may very well 'bounce' off the line and start moving in the opposite direction. The alerts allow you to take action when the lines are reached/closed without having to continually watch the chart.
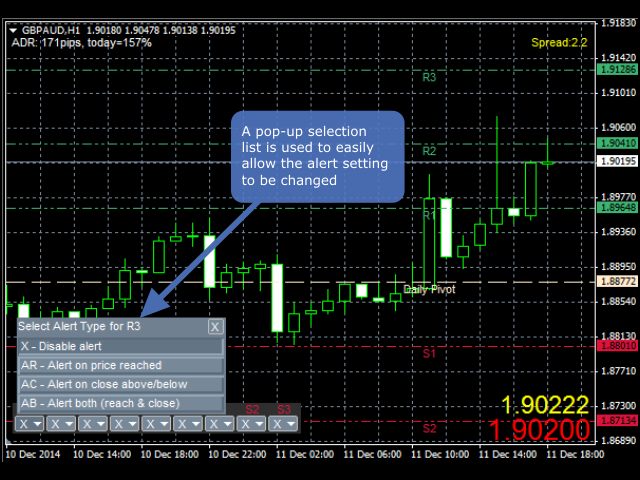
The alerts can be turned on and off on a per line basis simply by clicking the setting in the on-chart control panel of the indicator. A pop-up selection box allows you to set the alert you need.
For the alert to work, you must leave the chart open with the indicator placed on the chart. The alert can be set to pop-up, play wav file sound, email or notification.
The included Average Daily Range (ADR) shows you how many pips the currency pair normally moves in a day and how much it has done already today as a percentage. You should avoid opening a new trade if it is approaching or gone past 100%. Also, if the ADR is nearing 100%, then a 'bounce' off one of the support/resistance lines is more likely.
A bonus spread indicator will show the current spread, which can be configured to change color if the spread has gone too high. Also current ask/bid prices can be shown in big text. The prices will be colored green if gone up, red if gone down or yellow if stayed the same. The indicators are optional and fully configurable.
Indicator Inputs
Variable Description Main_showSupportResistance If true , support/resistance lines are shown on the chart Main_showDailyPivot If true , then daily pivot line is shown on the chart Main_showWeeklyPivot If true , then weekly pivot line is shown on the chart Main_showMonthlyPivot If true , then monthly pivot line is shown on the chart Main_showAverageRange If true , then Average Daily Range is shown (ADR) Main_averageRangeMode Switch from ADR to ATR (Average True Range) Main_averageRangeCorner Chart corner where ADR is displayed
Main_averageRangeX X location of ADR Main_averageRangeY Y location of ADR Main_averageDailyRangeDays Days used for ADR Main_averageTrueRangeDays Days used for ATR Style_lineForPivots Line style for pivot lines Style_lineForSuppRes Line style for support/resistance lines Color_support Color of support lines Color_resistance Color of resistance lines Color_daily Color of daily pivot Color_weekly Color of weekly pivot Color_monthly Color of monthly pivot Box_corner The corner of the chart the alert's control panel is displayed in. Default is bottom left. Box_X X co-ordinate of where the alert's control panel is displayed
Box_Y Y co-ordinate of where the alert's control panel is displayed