- This is the Full Version, to get the free version please contact me.
The free version works on “AUDNZD” and “XAUUSD” charts.
- All symbols and time frames scanner
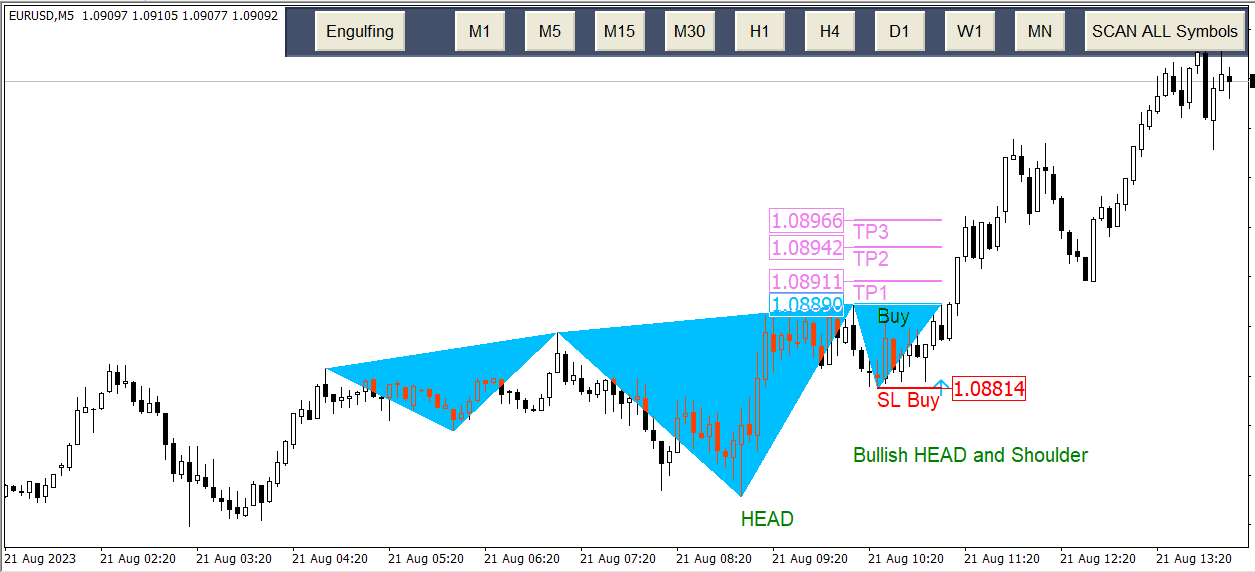
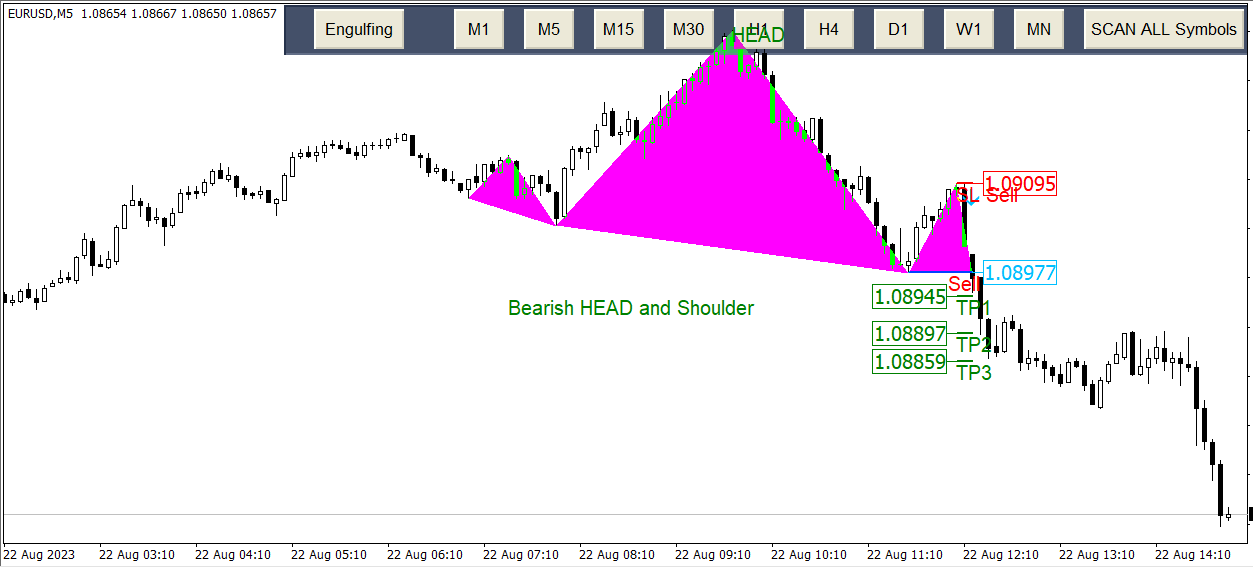
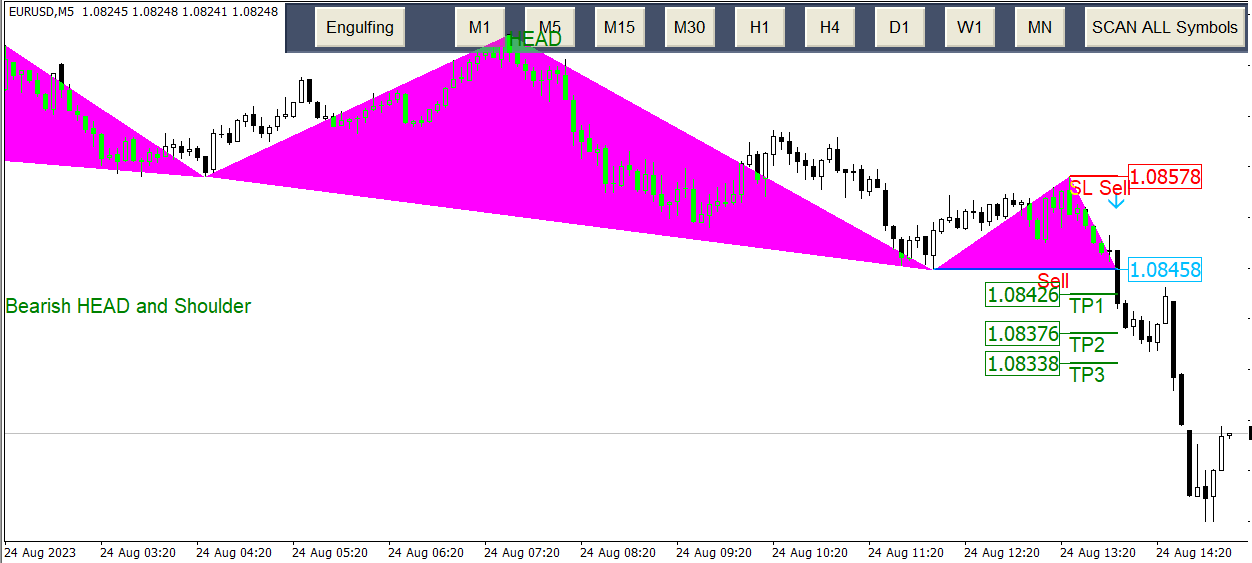
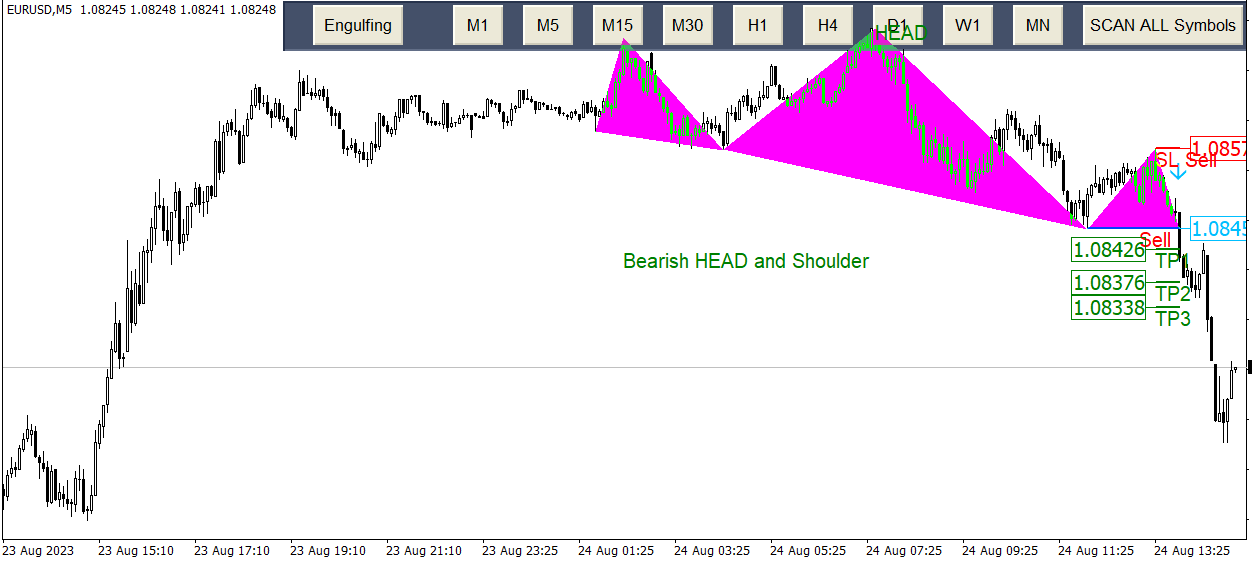
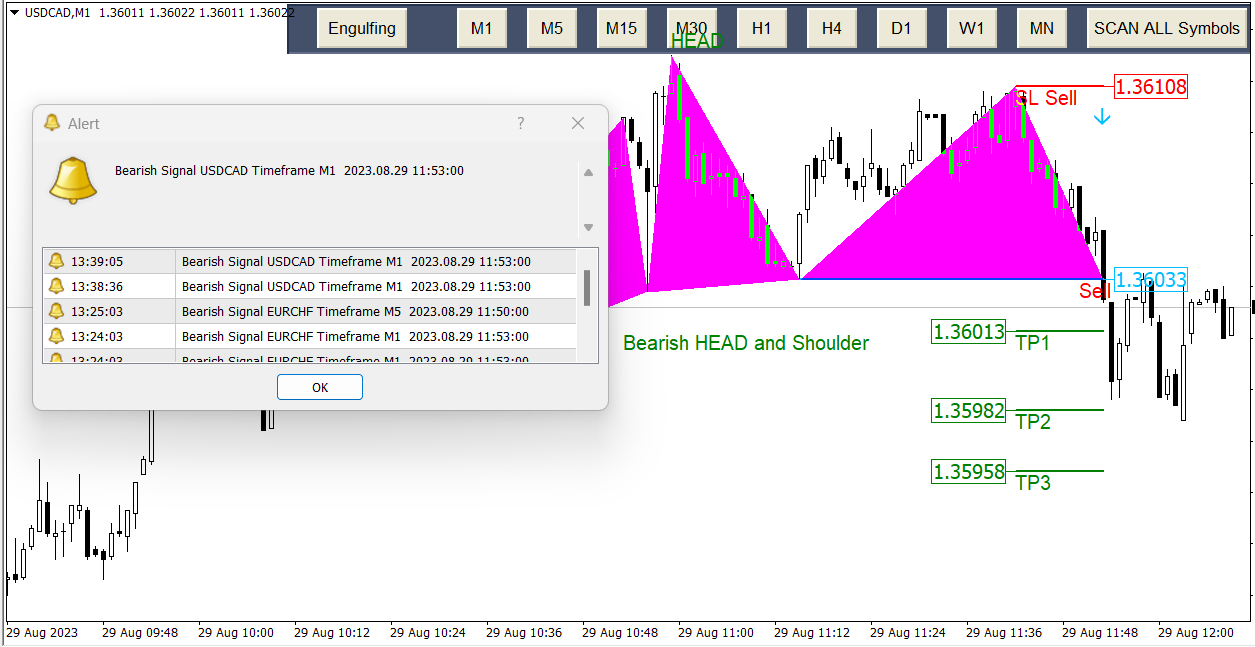
Head and Shoulder
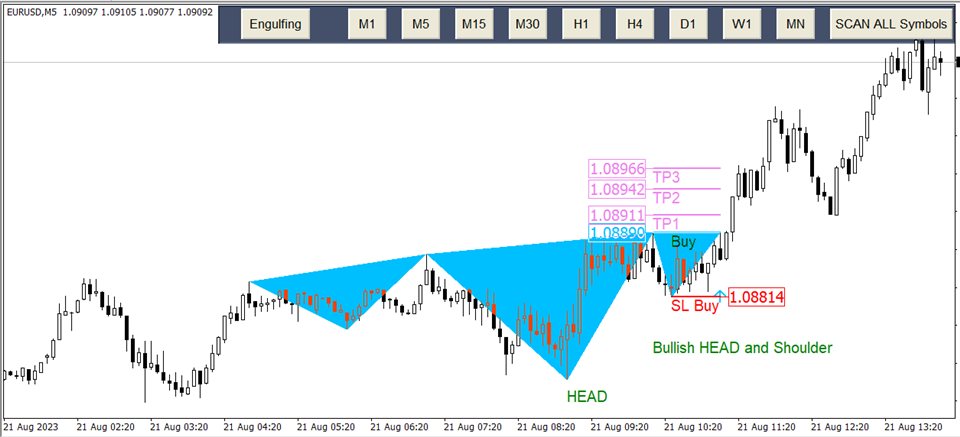
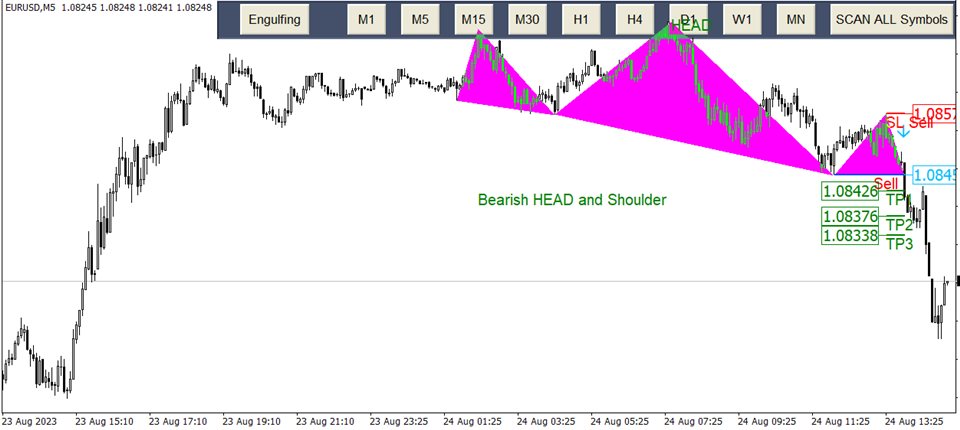
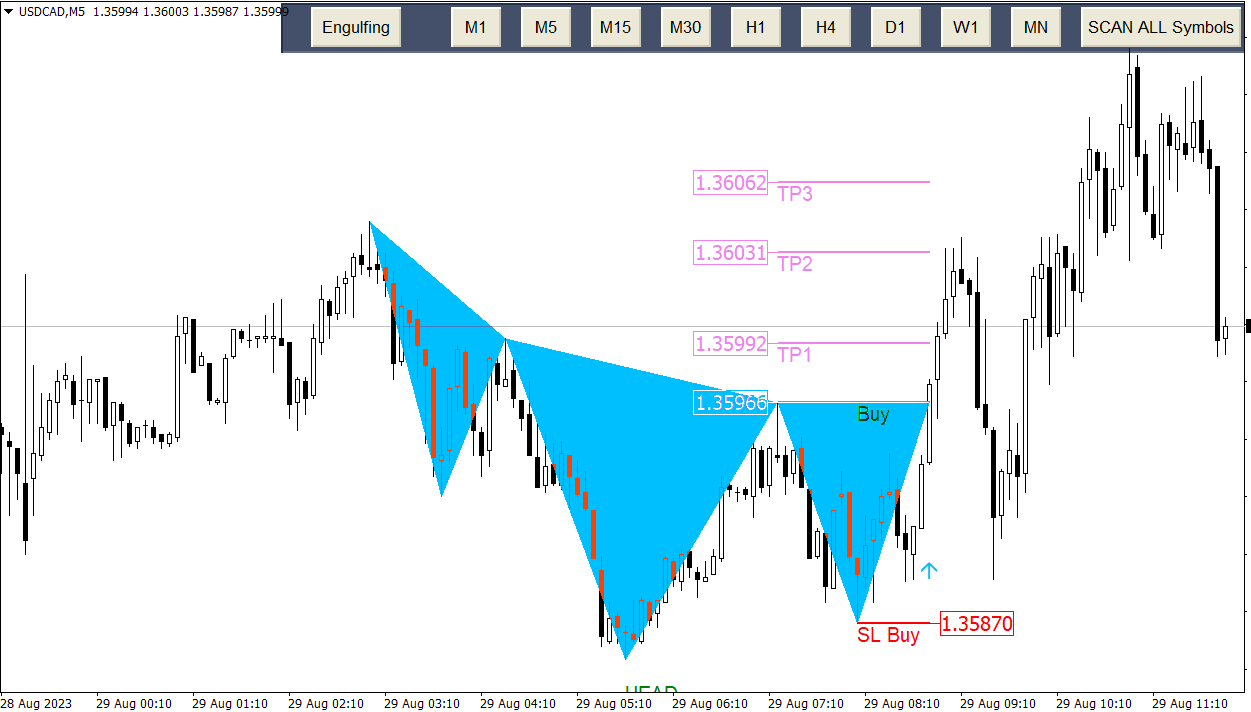
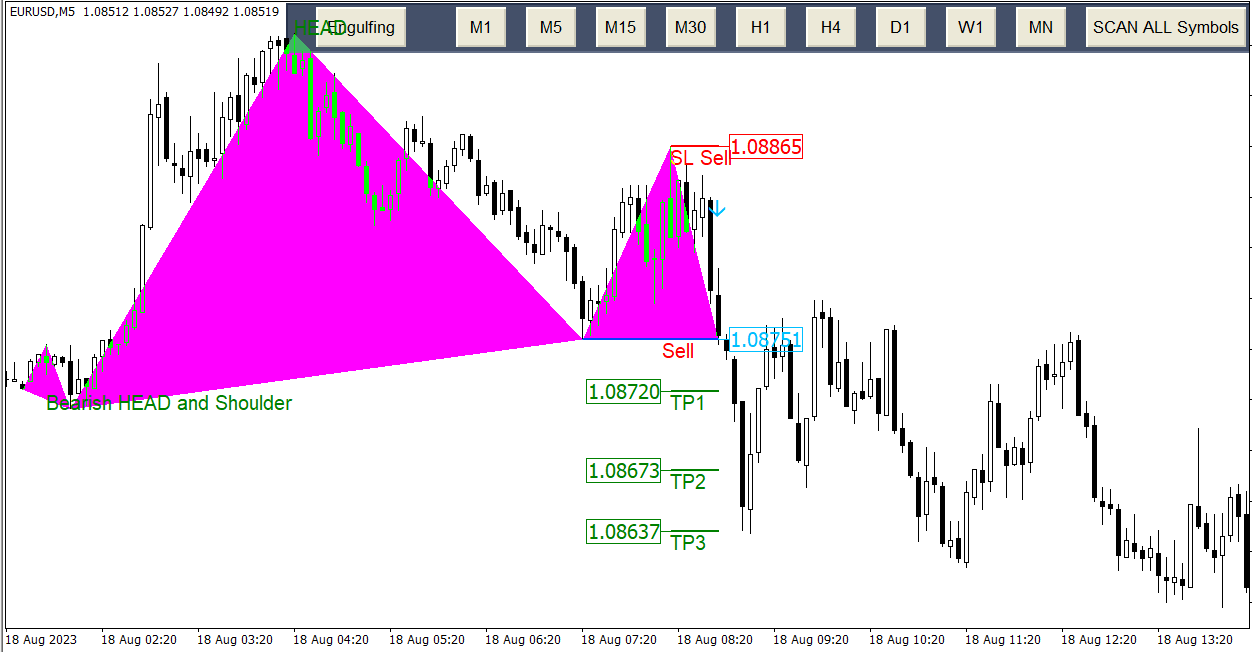
One of the most popular Price Action patterns is the Head and Shoulders pattern. The pattern has three local tops that resemble the left shoulder, head, and right shoulder. The head and shoulders chart pattern appears in all kinds of markets, including Forex, cryptocurrency, commodities, stocks, and bonds. The head and shoulders chart in a bullish market depicts a bullish-to-bearish trend reversal and signals that an upward trend is nearing its end. An inverse head and shoulders formation in a bearish market means the trend must have reached its bottom and could turn up. In this indicator, you can scan the head and shoulder pattern for the current symbol and time frame as well as other symbols and time frames. With Breakout, a message will be shown to you. A breakout is a potential trading opportunity that occurs when an asset's price moves above a resistance level or moves below a support level on increasing volume.
Head and Shoulder MT5 Here
Main Features
Easy-to-use and user-friendly indicator NO repaint Sending the alert and push notification and Email
Fibonacci level is added automatically Scan All charts Select and deselect time frames button for scan (M1,M5,M15,M30,H1,H4,D1,W1,MN)
Input Parameters
Display / Style Option
- Changing the color of the bullish and bearish head and shoulder breakout,TP,SL
- Changing line thickness
Alert Settings
- Display Alert, Enable or disable Alert
- Display Notification, Enable or disable Notification
- Send Email, Enable or disable Email