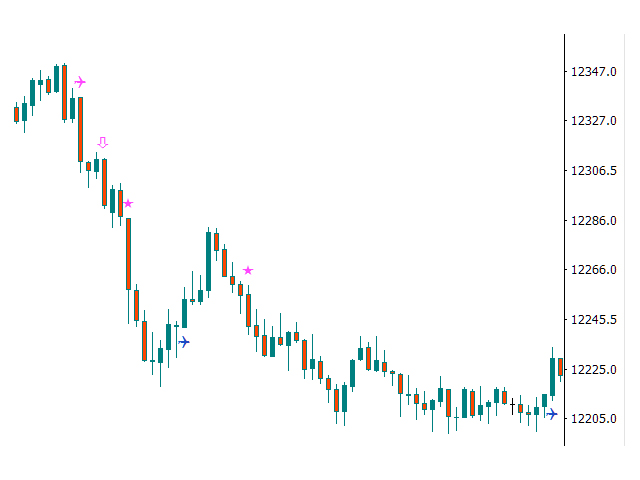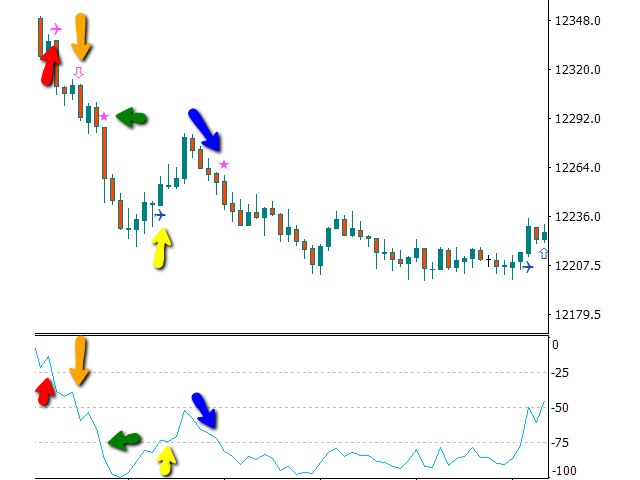
It draws on the main price chart icons indicating clearly the different crosses produced by the William% R oscillator signal as it passes through the overbought, oversold, and intermediate lines.
Allowed customization:
- Position of overbought/oversold lines
- Your prefered icons
- The color of each icon
- Periods to use in William% R
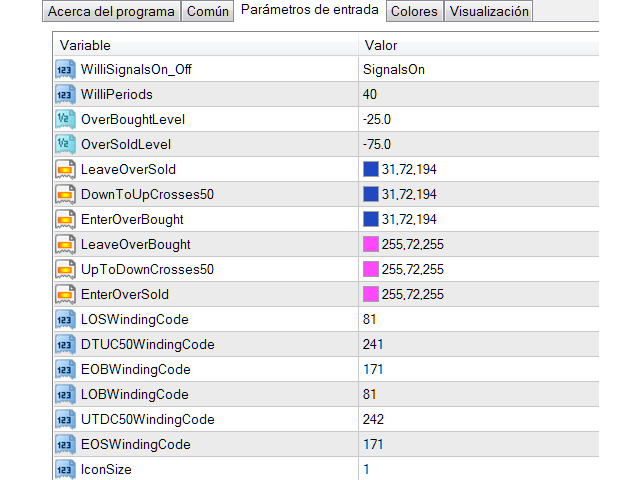
Parameters:
- WilliSignalsOn_Off: It allows you to hide/show the indicator without having to delete / re-add and configure this indicator
- WilliPeriods: Periods to configure the behavior of William% R Oscillator
- OverBoughtLevel: Overbought level, typically at -20.
- OverSoldLevel: Oversold level, typically at -80
- LeaveOverSold: Color of the icon that it is displayed when the indicator signal leaves OverBought area
- DownToUpCrosses50: Color of the icon that it is displayed when the indicator signal crosses from the bottom upwards the -50 line
- EnterOverBought: Color of the icon that it is displayed when the indicator signal crosses to OverBought
- LeaveOverBought: Color of the icon that it is displayed when the indicator signal crosses from OverBought and leaves that area
- UpToDownCrosses50: Icon color that it is displayed when the indicator signal crosses the -50 line from top to bottom
- EnterOverSold: Color of the icon that it is shown when the indicator signal crosses to OverSold area
- LOSWindingCode: (Leave OverSold) icon that it is displayed when the indicator signal leaves OverBought area
- DTUWindingCode: (Down To Up) icon that it is displayed when the indicator signal crosses from the bottom upwards the -50 line
- EOBWindingCode: (Enter OverBought) icon that it is displayed when the indicator signal crosses to OverBought
- LOBWindingCode: (LeaveOverBought) icon that it is displayed when the indicator signal crosses from OverBought and leaves that area
- UTDWindingCode: (UpToDownCrosses50) Icon color that it is displayed when the indicator signal crosses the -50 line from top to bottom
- EOSWindingCode: (EnterOverSold) icon that it is shown when the indicator signal crosses to OverSold area
- IconSize: Size of the icon to use in the graphic window
Where to choose the windings codes: https://docs.mql4.com/constants/objectconstants/wingdings
In the images shown as examples:
- The airplane represents the exits of the overbought zone and oversold
- Arrows pass through the -50 line
- The stars, the entrance of the indicator in the areas of overbought and oversold