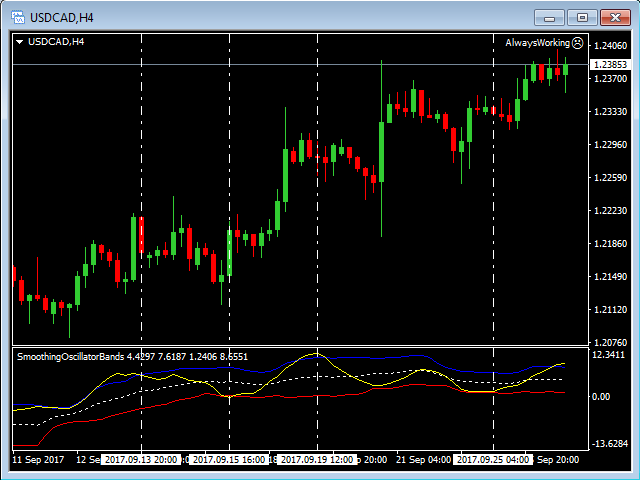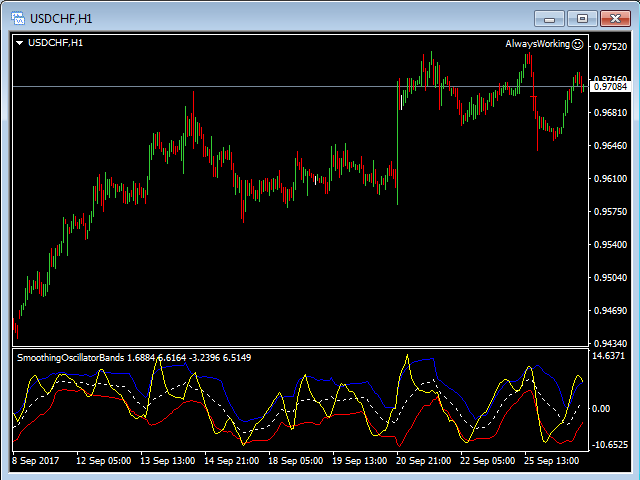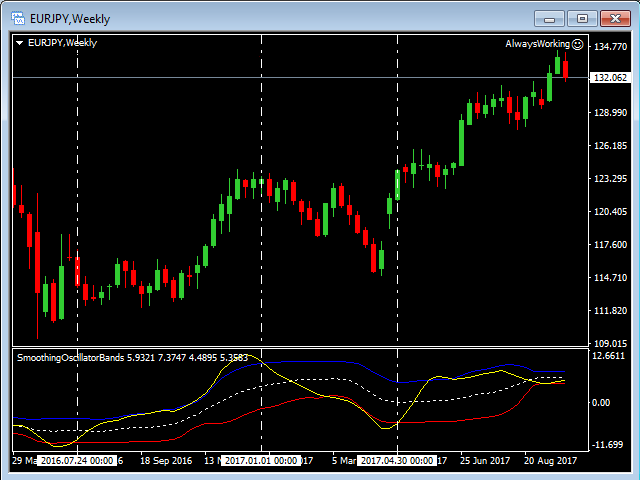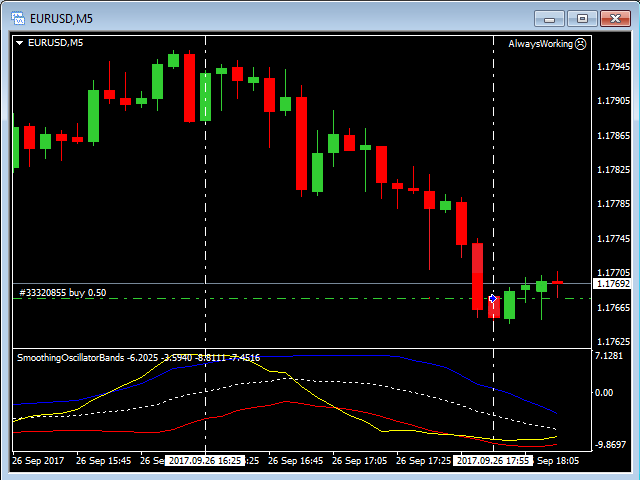
As all momentum indicators this oscillator is measuring the speed and change of price movement.
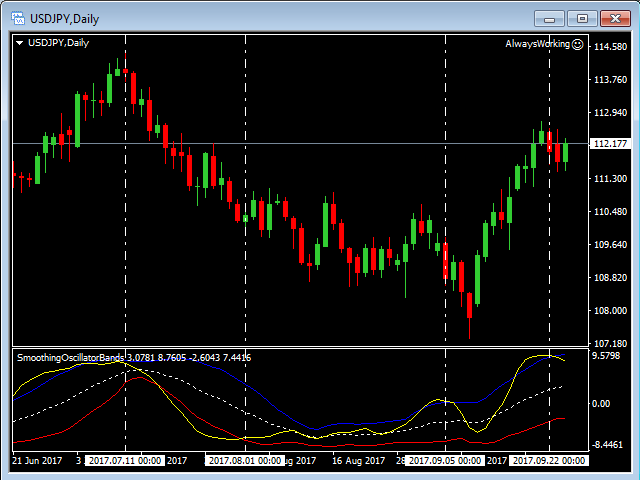
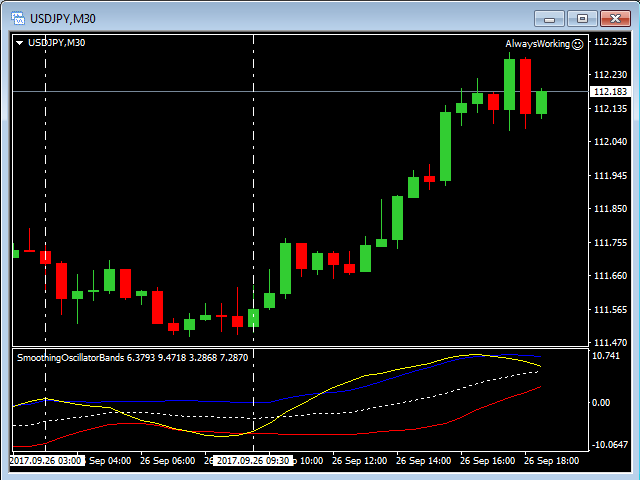
Momentum indicator is using an overbought and oversold conditions. The SmoothingOscillatorBands indicator is using a curve bands to show those conditions instead of constant levels. If the Yellow line is over a Blue line then we have an Overbought condition and when the Yellow line start to break out below the Blue line then we have a good opportunity to go Short. If the Yellow line is under a Red line then we have an Oversold condition and when the Yellow line start to break out above the Red line then we have a good opportunity to go Long.
- The Yellow line is an Oscillator main line of the indicator.
- The Red line is a Resistance line.
- The Blue line is a Support line.
- The White dotted line is a Center line.